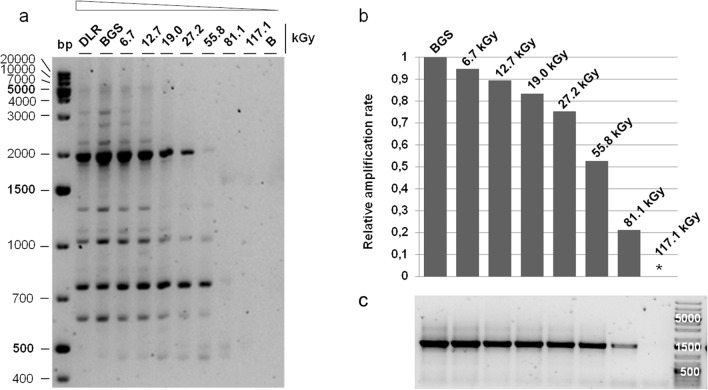
Fig. 5.
a Analysis of the genomic DNA integrity of I. hospitalis cells after γ-ray exposure. The RAPD profile was analyzed on a 2% agarose gel. The numbers indicate the applied dose. The arrow indicates decreasing genomic DNA integrity with increasing ionizing radiation dose applied. b qPCR with 16S rRNA primer to determine the relative amplification rate after γ-ray exposure. The C(t) values were normalized the minimum with DLR (laboratory control) acting as untreated reference sample. qPCR analysis was conducted with n = 1. c Primer specific qPCR amplicon analyzed on a 2% agarose gel, 2 µl were loaded per lane. *No signal, DLR laboratory control, BGS transport control, B blank sample (Koschnitzki 2016)

