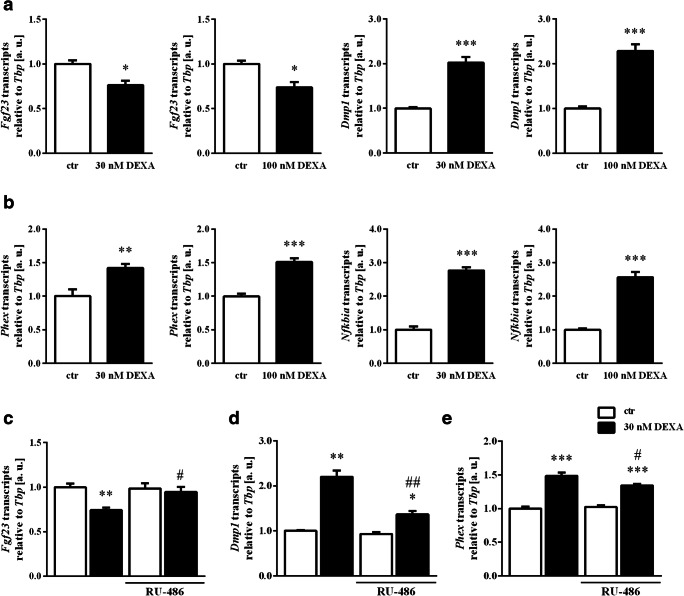
Fig. 2.
Impact of dexamethasone and glucocorticoid antagonist RU-486 on regulators of Fgf23 expression. Arithmetic means ± SEM (arbitrary units (a. u.)) of relative mRNA transcript levels of Fgf23, Dmp1 (a), Phex, and Nfkbia (b), all normalized to Tbp, in UMR106 cells treated with 30 nM (n = 9) or 100 nM dexamethasone (n = 7) (DEXA, black bars) or vehicle only (white bars) in the presence of 10 nM calcitriol for 24 h. *p < 0.05, **p < 0.01, ***p < 0.001 indicate statistically significant difference from vehicle-treated cells. Arithmetic means ± SEM (n = 6, arbitrary units (a. u.)) of relative mRNA transcript levels of Fgf23 (c), Dmp1 (d), and Phex (e), all normalized to Tbp in calcitriol-stimulated (10 nM for 24 h) UMR106 cells treated without (white bars) or with 30 nM dexamethasone (DEXA, black bars) in the absence or presence of the glucocorticoid receptor antagonist RU-486 (30 nM) for 24 h. *p < 0.05, **p < 0.01, ***p < 0.001 indicate statistically significant difference from vehicle-treated cells (first bar). #p < 0.05, ##p < 0.01 indicate statistically significant difference from the absence of RU-486 (2nd bar vs. 4th bar). (a and b: paired t test; c–e: one-way ANOVA followed by Tukey’s multiple comparisons test (c and e) or Games-Howell test (d))

