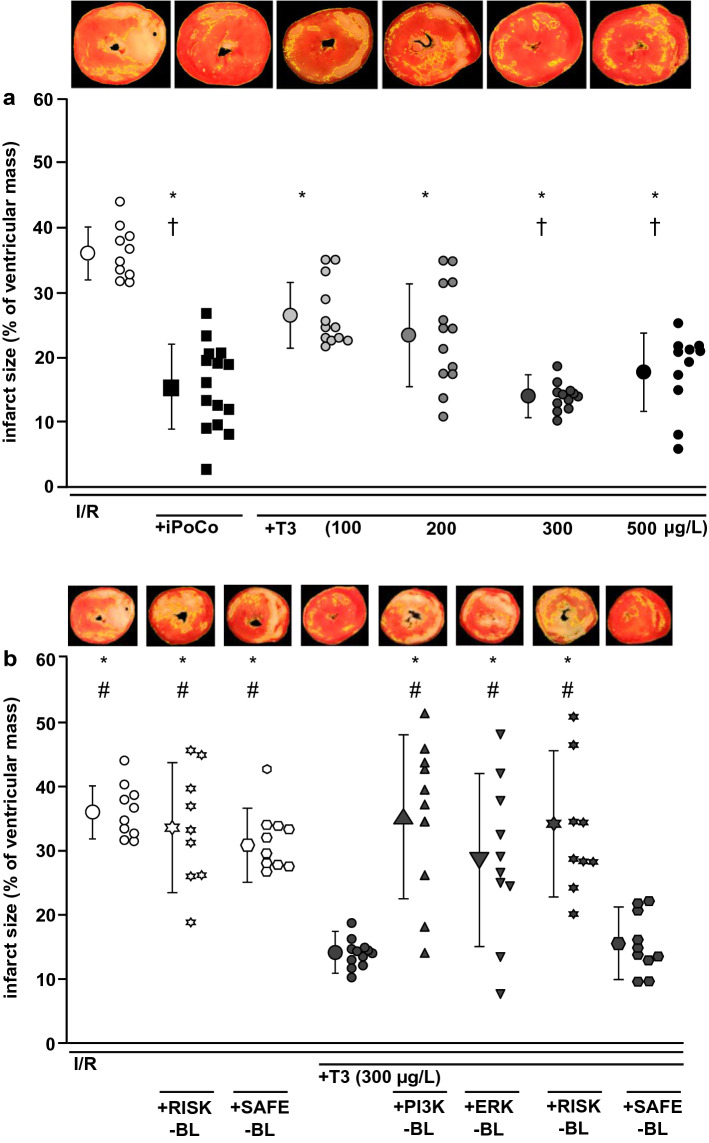
Fig. 2.
Impact of T3 at reperfusion on infarct size in isolated buffer-perfused rat hearts. Data are presented as means ± standard deviations. For each group, representative triphenyl tetrazolium chloride-stained heart slices are displayed; areas enclosed by yellow lines indicate infarcted tissue. ERK-BL mitogen extracellular-regulated-kinase phosphorylation blockade, iPoCo ischemic post-conditioning, I/R 30 min ischemia and 120 min reperfusion, PI3K-BL phosphatidylinositol(4,5)-bisphosphate-3-kinase blockade, RISK-BL reperfusion injury salvage kinase pathway blockade, SAFE-BL survival-activating factor enhancement pathway blockade, T3 triiodothyronine at reperfusion, a T3 at reperfusion—given in increasing concentrations; *p < 0.001 vs. I/R; †p < 0.01 vs. I/R + T3 (100 µg/L); one-way ANOVA with Fisher’s least significant differences post-hoc tests. b T3 at reperfusion—given under RISK or SAFE blockade; I/R and I/R + T3 (300 µg/L): groups are identical to those depicted in Fig. 1a; *p < 0.001 vs. I/R + T3 (300 µg/L); #p < 0.01 vs. I/R + T3 (300 µg/L) + SAFE-BL; one-way ANOVA with Fisher’s least significant differences post-hoc tests

