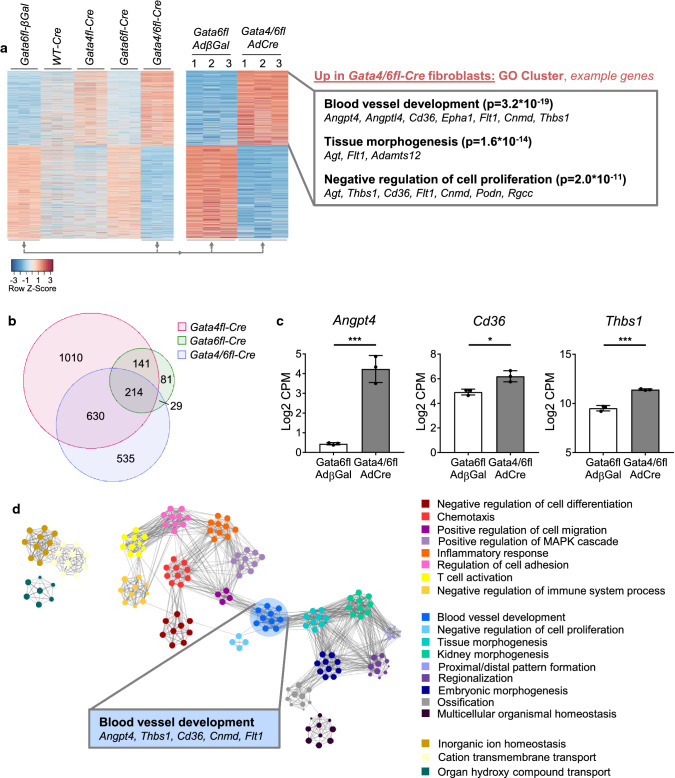
Fig. 5.
Transcriptome analysis of isolated cardiac fibroblasts showing an upregulation of anti-angiogenic genes in cells with Gata4/Gata6 deletion compared to control cells. a Heatmap of differentially regulated genes showing all analyzed groups (left panel) and direct comparison of Gata6fl-βGal (control) vs. Gata4/6fl-Cre (right panel) isolated cardiac fibroblast samples (n = 3 in each group). Gene ontology (GO, biological process) classification and selected example genes are demonstrated on the right. Bioinformatic analysis of RNA-Seq data is described in the “Materials and methods” section. b Venn diagram of significantly upregulated genes in fibroblasts with Gata4, Gata6, and Gata4/6 deletion compared to Gata6fl-βGal control samples. c RNA expression level of selected anti-angiogenic genes from RNA-sequencing. d Visualization of the top 20 GO BP clusters and relationships as a network plot. Each node represents an enriched term and is colored depending on its cluster ID, the cluster ID legend is shown on the right. Terms with a similarity > 0.3 are connected by edges. Data are shown as mean ± SD. Student’s t test was used for comparison of two groups. *p < 0.05, ***p < 0.001

