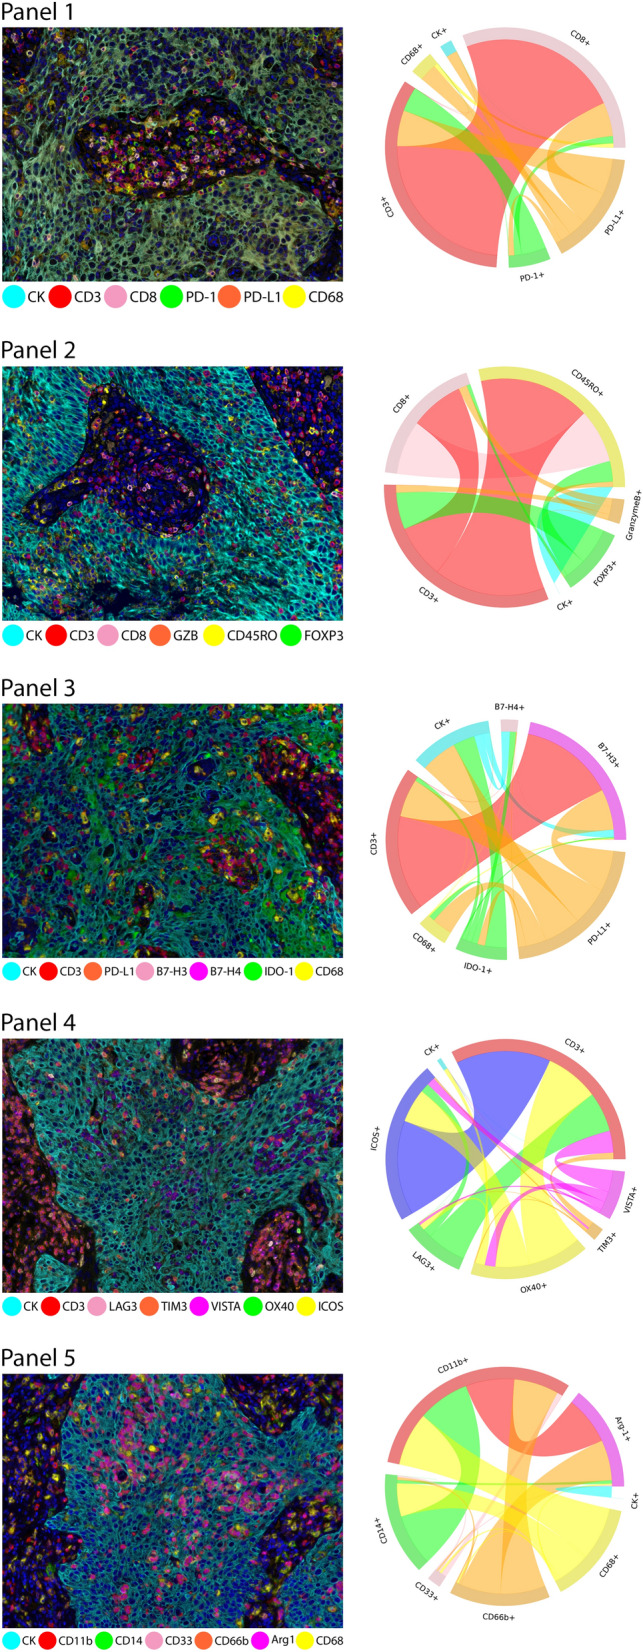
Figure 1.

Microphotographs of representative examples of multiplex immunofluorescence (mIF) and cord plots of cells co-expression of makers in the different immuno-oncology panels in the NSCLC cohort. For each panel, the composite mIF images (left) and the diversity of cell phenotypes by the markers co-expressed (right) are shown. mIF 20 × magnification. The images were generated using Vectra-Polaris 3.0.3 scanner system and InForm 2.4.8 image analysis software (Akoya Biosciences) and R studio software version 3.6.1.
