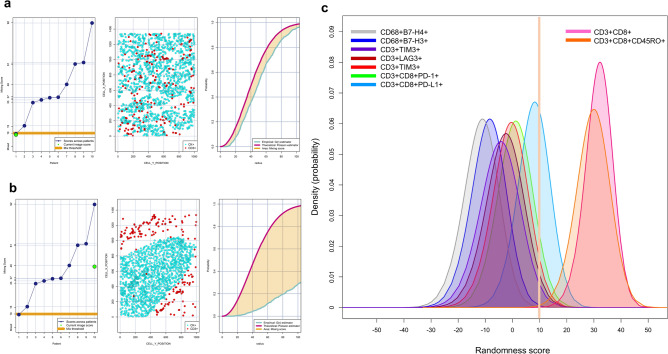
Figure 7.
Individual nearest neighbor distance G function and theoretical Poisson curves graphics for the identification of different cellular patterns of distance distribution from CK+ malignant cells to CD3+T-cells and graphic representation of the predominate cell phenotypes that characterize those patterns. (a and b) The scoring scale across the cases and the threshold to be considered mixed or unmixed pattern (left), graphic distribution representation of the CD3+T-cells and CK+cells (middle), and the nearest neighbor distance G function and theoretical Poisson curves area (right). (a) Mixed pattern distribution of CD3+T-cells related to CK+cells, (b) unmixed pattern distribution of CD3+T-cells related to CK+cells, (c) graphical model showing the characterization of two different groups of interaction between specific phenotypes with malignant cells according their spatial distribution. Suppressor cell phenotypes have scores less than 10 and are characterized by a mixed pattern and more interaction with malignant cells, while cytotoxic T-cells (CD3+CD8+) and cytotoxic memory T-cells (CD3+CD8+CD45RO) have scores greater than 10 and are characterized by an unmixed pattern with less interaction to malignant cells. The images were generated using R studio software version 3.6.1.

