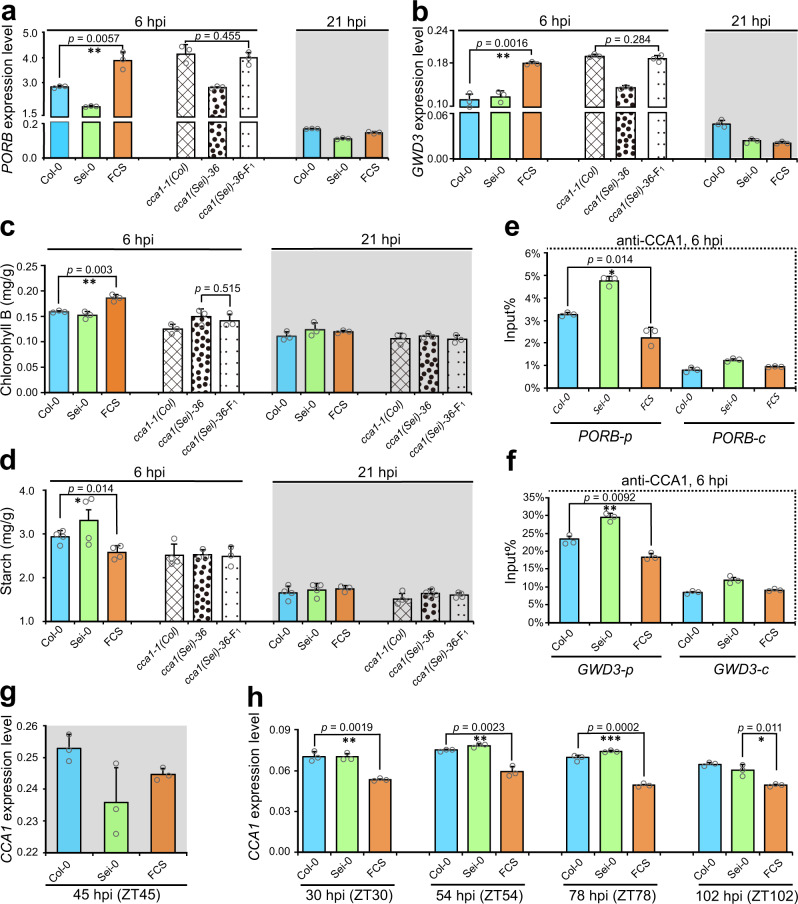
Fig. 4. CCA1 eliminates defense-growth heterosis trade-offs in hybrids by a time-scheduled regulation strategy.
qPCR analyses of PORB’s (a) and GWD3’s (b) expression level in the F1 hybrids and parents of Col-0 × Sei-0 at 6 hpi and 21 hpi and of cca1-1(Col) × cca1(sei)-36 at 6 hpi. Data are standardized for the abundance of the ACTIN2 transcript. Data are shown as the mean ± SD (n = 3, n indicates biological replicates). c Chlorophyll B content of inoculated leaves in the F1 hybrids and parents of Col-0 × Sei-0 and cca1-1(Col) × cca1(sei)-36 at 6 hpi and 21 hpi. Data are shown as the mean ± SD (n = 4, n indicates biological replicates, six leaves for each biological replicate). d Starch content in the inoculated leaves after removing soluble sugar in the F1 hybrids and parents of Col-0 × Sei-0 and cca1-1(Col) × cca1(sei)-36 at 6 hpi and 21 hpi. Data are shown as the mean ± SD (n = 4, n indicates biological replicates, six leaves for each biological replicate). ChIP-qPCR analyses of promoter fragments that contained the “evening element” motif (PORB-p and GWD3-p) and exon fragments (PORB-c and GWD3-c) of PORB (e) and GWD3 (f) in F1 hybrids and their parents using an anti-CCA1 antibody at 6 hpi. ChIP values were normalized to their respective DNA inputs. The results are representative of three biological replicates with measurements taken from independent samples grown and processed at different times. Data are shown as the mean ± SD (n = 3, n indicates biological replicates). qPCR analyses of CCA1 expression in F1 hybrids and the parents of Col-0 × Sei-0 at 45 hpi (ZT45) (g) and at 30 hpi (ZT30), 54 hpi (ZT54), 78 hpi (ZT78), and 102 hpi (ZT102) (h). The expression level of CCA1 were shown as the mean ± SD (n = 3, n indicates biological replicates). Data are standardized for the abundance of the ACTIN2 transcript. hpi hours post inoculation. *p value < 0.05; **p value < 0.01; and ***p value < 0.001 (two-tailed Student’s t test).

