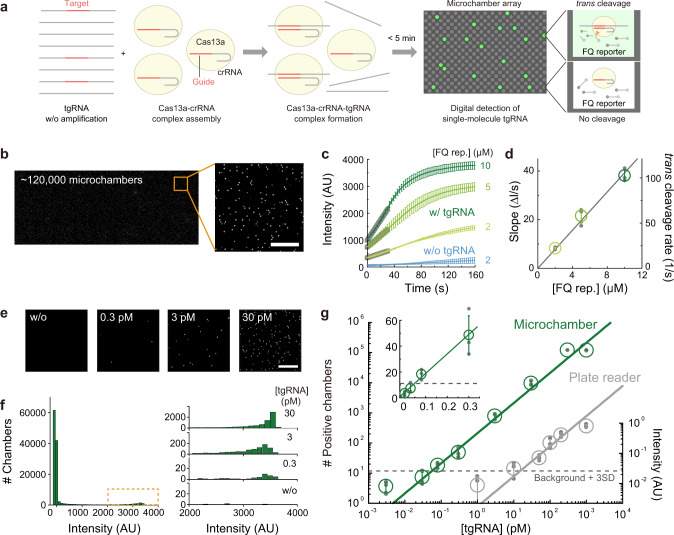
Fig. 1. Amplification-free digital RNA counting with CRISPR–Cas13 in a microchamber array device.
a Schematic illustration of SATORI. LwaCas13a–crRNA–tgRNA cleaves FQ reporters, leading to fluorescence increases in a microchamber array device. b Representative fluorescence image obtained by SATORI in the presence of 30 pM tgRNA. Forty images acquired by tiling imaging were combined. An enlarged view of the orange square is shown on the right. Scale bar is 50 μm. c, d Time course of fluorescence increase (c) and rates of trans cleavage (d) by LwaCas13a–crRNA–tgRNA with different concentrations of the FQ reporter. In c, average values of ten representative traces are shown with error bars (S.D.). In d, data are mean ± S.D. (n = 3 technical replicates). e Representative fluorescence images obtained with different concentrations of tgRNA. Scale bar is 50 μm. f Histograms of mean intensity values in each chamber (~120,000 chambers in the combined image). Enlarged views of the orange dotted box, with different concentrations of tgRNA, are shown on the right. g Comparison of LwaCas13a-mediated RNA detection methods in a microchamber device (SATORI, green) and a plate reader (gray), without recombinase polymerase amplification. Data are mean ± S.D. (n = 3 technical replicates), fitted to linear regressions. The dotted line is the value of the background mean + 3 S.D. LOD values for SATORI and the plate reader-based bulk assay were 56 fM and 11 pM, respectively.

