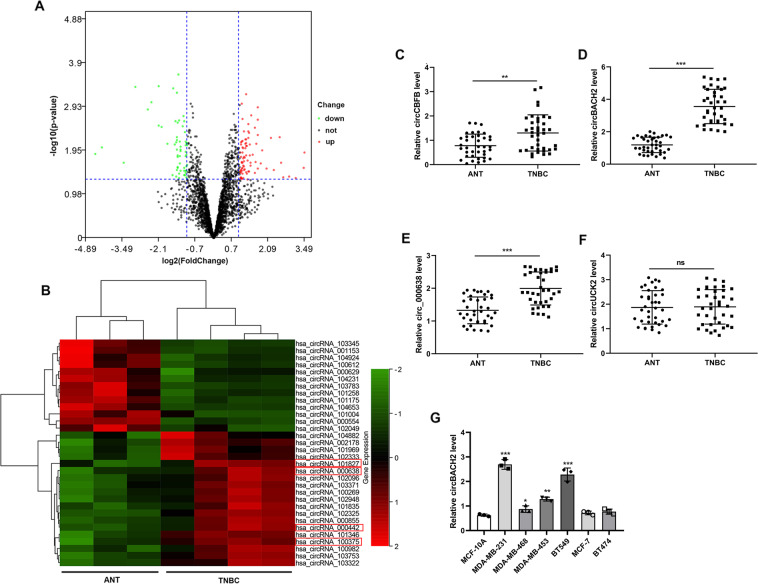
Fig. 1. circBACH2 was upregulated in triple-negative breast cancer (TNBC) tissues and TNBC cell lines.
The microarray dataset that is related to TNBC (GSE101123) was downloaded. A The volcano plot visualized the expressions of circRNA between TNBC cancerous tissues (n = 4) and adjacent normal tissues (ANT; n = 3). The red dots and green dots represent upregulated and downregulated circRNAs with statistical significance, respectively. B Clustered heat map of the differentially expressed circRNAs in TNBC cancerous tissues (n = 4) and ANT (n = 3). Rows represent circRNAs and columns represent tissue types. The color scale runs from green (low intensity) to black (medium intensity), to red (strong intensity). C–F Thirty-eight pairs of TNBC cancerous tissues and ANT were obtained from TNBC patients (n = 38). The expression levels of circCBFB, circ_000638, circBACH2, and circUCK2 were determined using qRT-PCR. **P < 0.01, ***P < 0.001. ns no significance. G The expression level of circBACH2 in the normal mammary gland cell line MCF-10A, TNBC cell lines (MDA-MB-231, MDA-MB-468, MDA-MB-453, and BT-549), estrogen receptor (ER)+/human epidermal receptor 2 (HER2)− cell line MCF-7, and ER+/HER2+ cell line BT-474 was determined using qRT-PCR. *P < 0.05, **P < 0.01, ***P < 0.001 vs MCF-10A.

