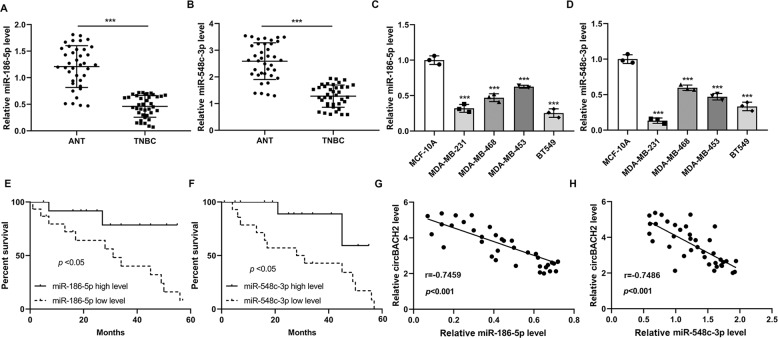
Fig. 5. miR-186-5p and miR-548c-3p were downregulated in TNBC tissues.
The expression levels of A miR-186-5p and B miR-548c-3p in TNBC (n = 38) and ANT tissues (n = 38). ***P < 0.001. The expression levels of C miR-186-5p and D miR-548c-3p in the normal mammary gland cell line MCF-10A and TNBC cell lines (MDA-MB-231, MDA-MB-468, MDA-MB-453, and BT-549). ***P < 0.001 vs MCF-10A. E, F The survival curve of patients with low/high miR-186-5p/miR-548c-3p level. G, H The correlation between circBACH2 level and miR-186-5p/miR-548c-3p level in TNBC tissues (n = 38).

