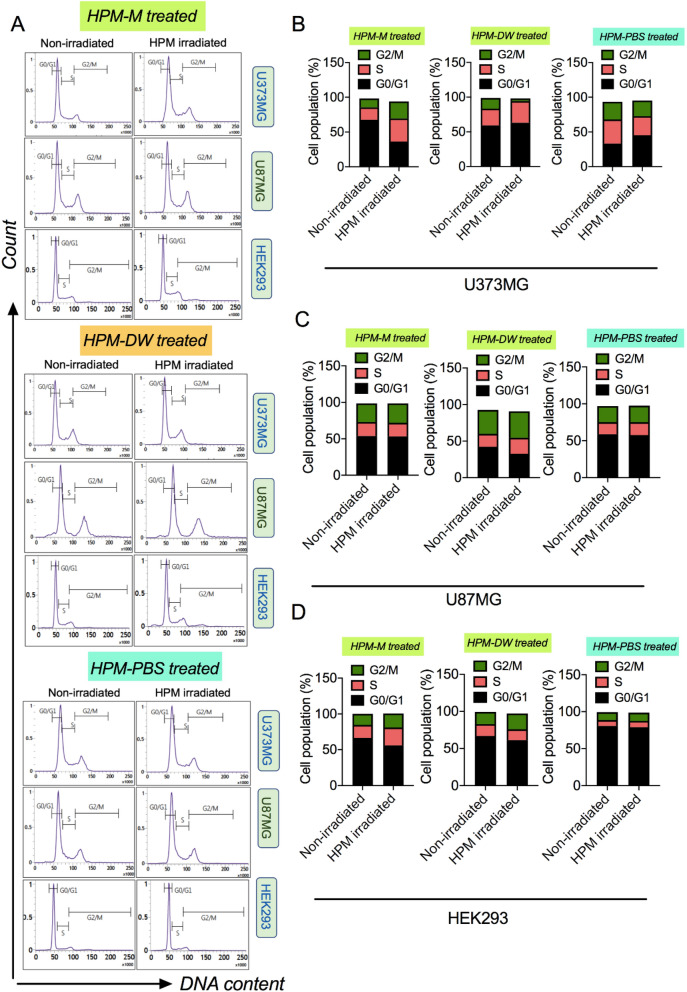
Figure 7.
Cell cycle dynamics in cells after treatment with high power microwave-irradiated solutions. (A) Representative FACS histogram plots showing the cell populations of U373MG, U87MG, and HEK293 cells treated with high power microwave (HPM)-irradiated Media (upper side), HPM-irradiated DW (middle side), and HPM-irradiated PBS (lower side) in different cell cycle phases. (B–D) Percentage distribution of each cell population in the respective cell cycle stage of the cells shown in (A). The groups represented are cells treated with HPM-irradiated Media, DW, and PBS.

