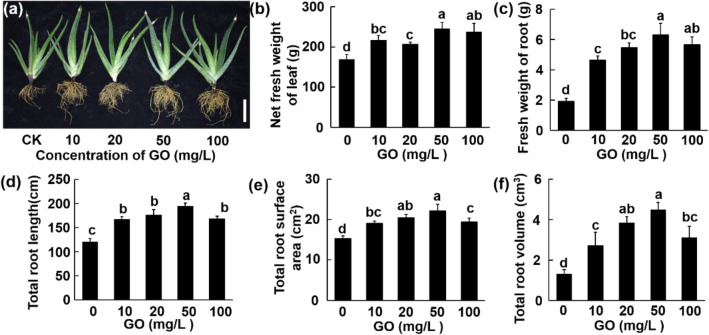
Fig. 2.
Phenotype of Aloe vera seedlings after incubation with different concentrations (0–100 mg/L) of GO for 4 months. a Phenotypical image of Aloe vera grown in GO-amended soil (scale bar: 10 cm); b net fresh weight of leaf; c fresh weight of root; d total root length; e total root surface area; f total root volume. Values are means ± SD (n = 5). Means with different letters are significantly different by LSD test (p ≤ 0.05)

