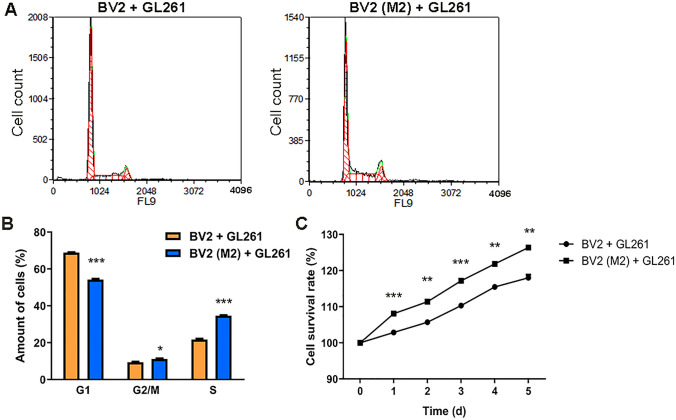
Fig. 2.
M2 phenotype microglia promote glioma proliferation. A Cell cycle of GL261 was detected by flow cytometry (FCM) following PI staining. The abscissa represents the DNA content and the ordinate represents the cell counts. B The results of cell cycle analysis. Yellow and blue bars represent the GL261 + BV2 group (n = 3) and the GL261 + BV2 (M2) group (n = 3), respectively. C Survival curve of GL261 cells within 1–5 days after co-culture (CCK-8 assay). The abscissa is the number of days and the ordinate is the cell survival rate (n = 3). *P < 0.05, **P < 0.01, ***P < 0.001.

