Fig. 8.
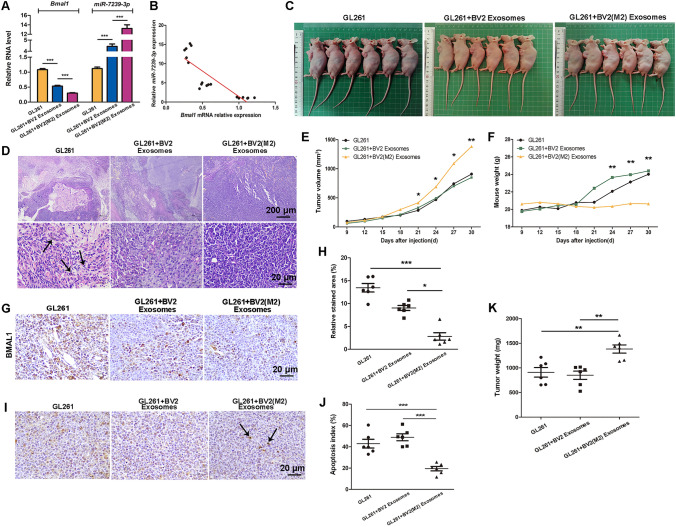
M2 phenotype microglial exosomes promote glioma growth in vivo. A Real-time qPCR was used to verify relative expression levels of Bmal1 and miR-7239-3p in tumor tissues. The internal reference genes were β-actin and U6, respectively. B Fitting curve of the correlation analysis between the relative expression levels of miR-7239-3p and Bmal1. C The subcutaneous tumor formation in nude mice. D The pathological morphology of glioma tissue after HE staining. Arrows indicate the fragmented nuclei (karyorrhexis). E The curve graph of tumor volume changes with time in each group. F The curve of mouse weight change with time in each group. G, H IHC was used to detect the expression of BMAL1 protein in each group. I The TUNEL apoptosis staining of each group. J The statistical analysis results of apoptosis index. K The tumor weight in each group (n = 6). *P < 0.05, **P < 0.01, ***P < 0.001.

