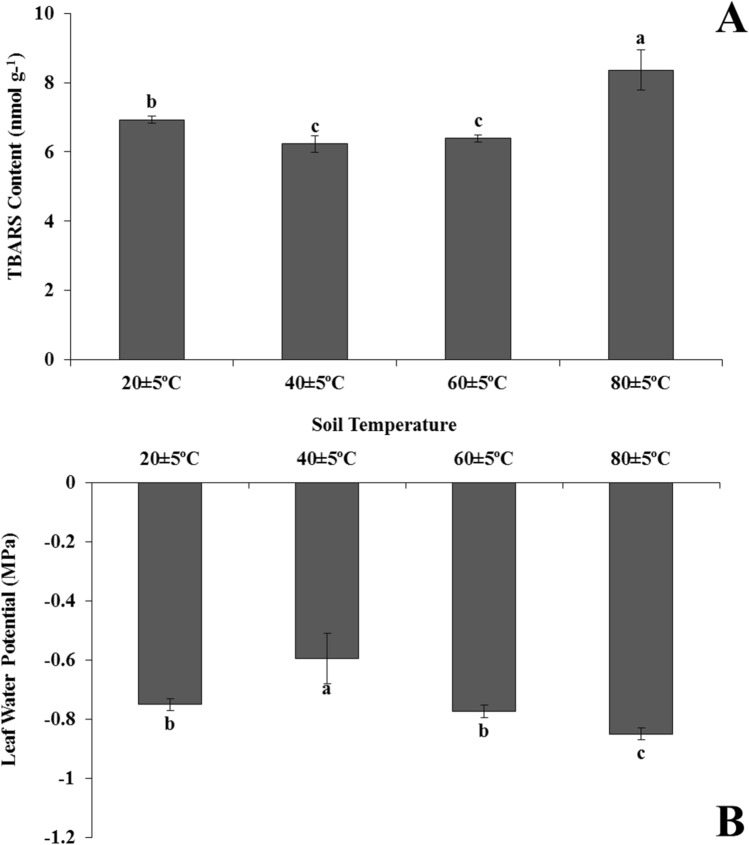
Fig. 2.
Changes of TBARS content (a), leaf water potential (b) in the leaves of Heliotropium thermophilum growing in soil at 20 ± 5 °C, 40 ± 5 °C, 60 ± 5 °C and 80 ± 5 °C. Vertical bars represent standard deviations of the means of three replicates. Different letters denote significant differences among all treatments at P < 0.05

