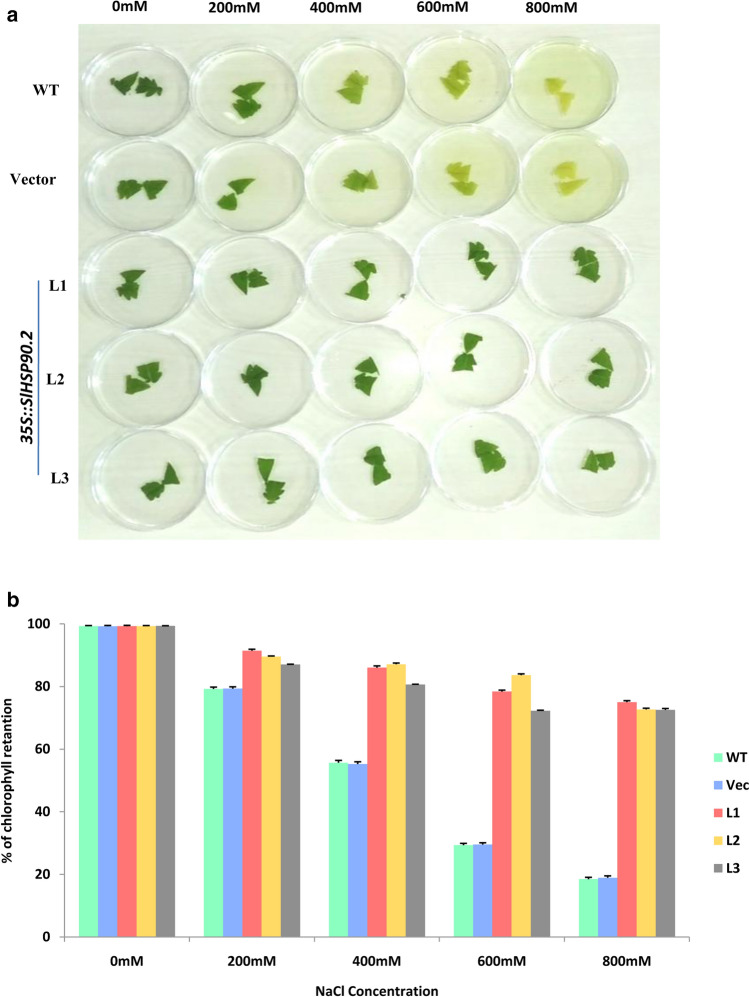
Fig. 7.
SlHSP90.2 transgenic lines showed increased salt tolerance as compared to control plants. a The leaf pieces from control plants and SlHSP90.2 transgenic plants were floated on 0 (control), 200, 400, 600 and 800 mM NaCl salt solutions. b Quantitative analysis of % chlorophyll retention in the different genotypes subjected to salt stress at the end of 72 h on the different NaCl concentrations tested. The error bars in the graph represent the standard deviation of the values taken from all the three transgenic lines

