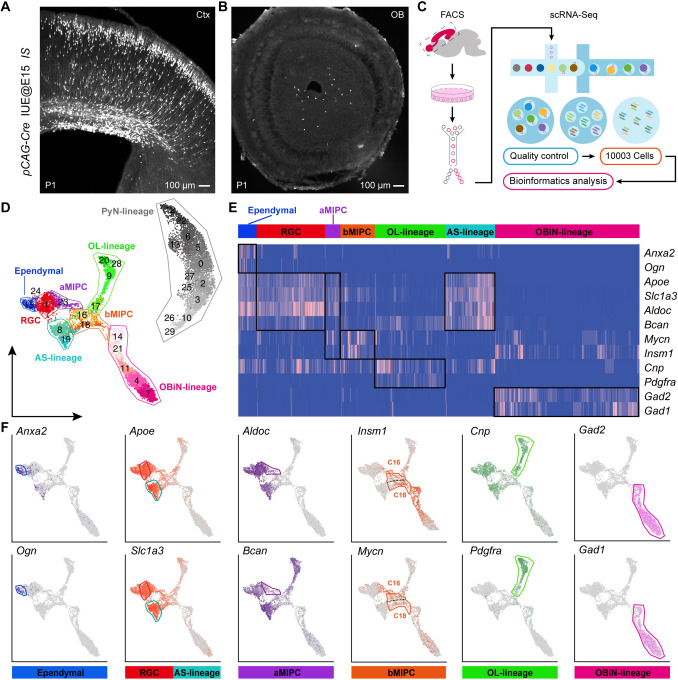
Fig. 1.
scRNA-Seq analysis of the P1 progeny of E15 cortical RGCs. A, B Representative images showing many cortical tdT+ cells and few OB tdT+ cells at P1 (pCAG-Cre plasmids were delivered into the cortical VZ of IS reporter mouse embryos at E15.0 by in utero electroporation). C Schematic of the workflow of scRNA-Seq analysis. Single tdT+ cells were isolated using FACS. D UMAP showing 30 clusters (C0–C29); the major cell types are annotated. E Heatmap showing cluster annotations, cell type assignments (x-axis) and expression of 12 marker genes (y-axis). F Feature plots of the 12 marker genes in 7 different cell types.

