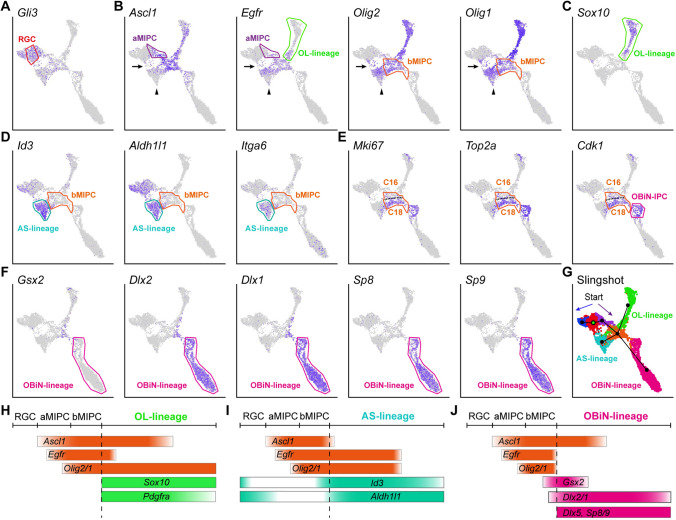
Fig. 2.
Expression of IPC-specific marker genes and their lineage progression. A-F Feature plots of marker genes for RGCs, aMIPCs, bMIPCs, and OL-lineage, AS-lineage, OBiN-lineage cells. Broad cell types (cell lineages) are shown rather than individual clusters. Note a small number of cells between RGCs and AS-lineage cells (arrows in B); they might be RGCs that were translocating to the cortex. Also note the gradual downregulation of Ascl1, Egfr, and Olig2/1 expression in AS-Iineage cells (arrowheads in B). G Predicted cell lineage trajectories from RGCs. H-J Schematic of the aMIPC and bMIPC lineage progression.

