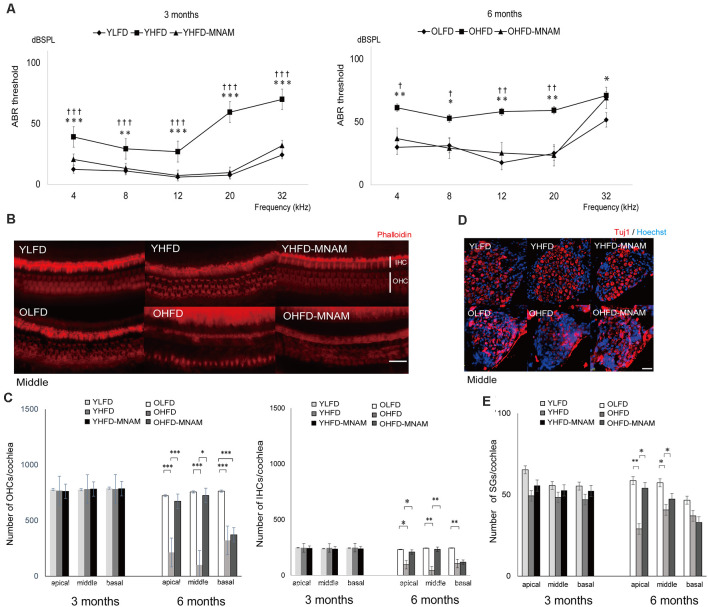
Figure 3.
The onset of age-related hearing loss (ARHL) and effect of MNAM supplementation on ARHL: developmental changes in auditory thresholds, hair cell counts, and spiral ganglion cell counts in the three tested mice groups. (A) The ABR recording results at 3 and 6 months after commencement of the experiment. All groups developed age-related hearing loss at 6 months, rather than at 3 months (YLFD: p = at 4 kHz, p = at 8 kHz, p = at 12 kHz, p = at 20 kHz, and p = at 32 kHz, YHFD: p = at 4 kHz, p = at 8 kHz, p = at 12 kHz, p = at 20 kHz, and p = at 32 kHz, YHFD-MNAM: p = at 4 kHz, p = at 8 kHz, p = at 12 kHz, p = at 20 kHz, and p = at 32 kHz). The YHFD and OHFD developed severe hearing loss compared with the YLFD and OLFD mice (YHFD vs. YLFD: p < 0.001 at 4 kHz, p = 0.006 at 8 kHz, p < 0.001 at 12 kHz, p < 0.001 at 20 kHz, and p < 0.001 at 32 kHz, OHFD vs. OLFD: p = 0.003 at 4 kHz, p = 0.01 at 8 kHz, p = 0.003 at 12 kHz, p = 0.003 at 20 kHz, and p = 0.03 at 32 kHz). All groups, n = 5, *p < 0.05, **p < 0.01, ***p < 0.001. In the YHFD-MNAM and OHFD-MNAM groups, hearing loss was prevented markedly compared with the YHFD and YLFD groups (YHFD-MNAM vs. YLFD-MNAM: p < 0.001 at 4 kHz, p = 0.004 at 8 kHz, p < 0.001 at 12 kHz, p < 0.001 at 20 kHz, and p < 0.001 at 32 kHz, OHFD-MNAM vs. OLFD: p = 0.01 at 4 kHz, p = 0.04 at 8 kHz, p = 0.006 at 12 kHz, p = 0.005 at 20 kHz, and p = 0.40 at 32 kHz). All groups, n = 5, †p < 0.05, ††p < 0.01, †††p < 0.001. (B) Phalloidin-staining of the HCs in a surface preparation in the middle turn at 3 and 6 months after experiment initiation. The OHFD mice developed greater OHC and IHC loss than the other two groups. The OHFD-MNAM mice exhibited lower OHC and IHC loss compared with the OHFD mice. (C) The OHC and IHC counts in all turns at 3 and 6 months after commencement of the experiment. The YHFD mice did not develop OHC and IHC loss, compared to the other two groups (YLFD; OHC: p = 0.10 at apical, p = 0.09 in the middle, p = 0.13 at basal, IHC: p = 0.78 at apical, p = 0.61 in the middle, p = 0.43 at basal, YHFD-MNAM; OHC: p = 0.63 at apical, p = 0.10 in the middle, p = 0.62 at basal, IHC: p = 0.34 at apical, p = 0.23 in the middle, p = 0.41 at basal). The OHFD mice developed greater OHC and IHC loss than the other two groups (OLFD; OHC: p < 0.001 in all turns, IHC: p = 0.04 at apical, p = 0.008 in the middle, p = 0.002 at basal, OHFD-MNAM mice; OHC: p < 0.001 at apical, p = 0.01 in the middle, p = 0.67 at basal, IHC: p = 0.04 at apical, p = 0.009 in the middle, p = 0.29 at basal). All groups, n = 5, *p < 0.05, **p < 0.01, ***p < 0.001. (D) The immunostaining of the SGCs using the anti-Tuj1 antibody in the middle turn at 3 and 6 months after commencement of the experiment. The OHFD mice developed greater SGC loss than the other two groups. The OHFD-MNAM mice exhibited lower SGC loss compared with the OHFD mice. (E) The SGC counts in all turns at 3 and 6 months after commencement of the experiment. There were no significant differences in SGC numbers between YLFD and YHFD (p = 0.09 at apical, p = 0.28 in the middle, p = 0.10 at basal), and between YHFD and YHFD-MNAM mice (p = 0.31 at apical, p = 0.30 in the middle, p = 0.07 at basal). The OHFD mice developed greater SGC loss than the OLFD mice, except for the basal turn (p = 0.002 at apical, p = 0.03 in the middle, p = 0.07 at basal). The OHFD-MNAM mice exhibited less SGC loss than the OHFD mice (p = 0.01 at apical, p = 0.01 in the middle, p = 0.21 at basal). All groups, n = 5, *p < 0.05, **p < 0.01, ***p < 0.001 (Bars: 100 μm; YLFD, low-fat diet-fed 3-month-old mice; OLFD, low-fat diet-fed 6-month-old mice; YHFD, high-fat diet-fed 3-month-old mice; OHFD, high-fat diet-fed 6-month-old mice; YHFD-MNAM, high-fat diet plus 1% N1-methylnicotinamide-fed 3-month-old mice; OHFD-MNAM, high-fat diet plus 1% N1-methylnicotinamide-fed 6-month-old mice; OHCs, outer hair cells; IHCs, inner hair cells; SGCs, spiral ganglion cells; anti-Tuj1, anti-beta III tubulin).

