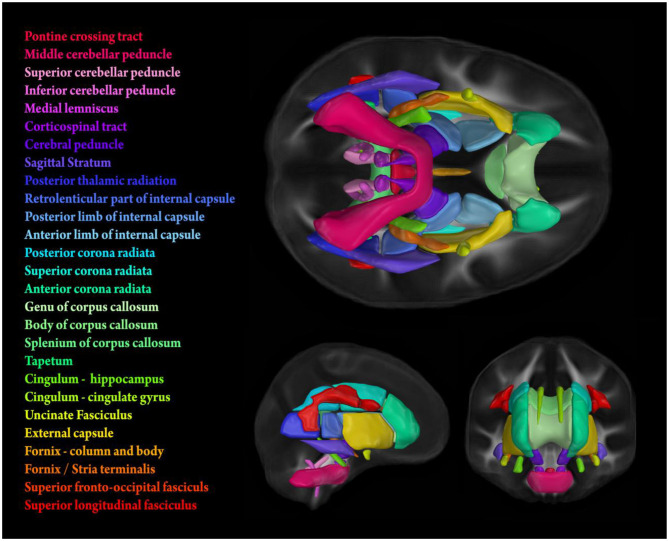
Figure 1.
Stylized depiction of 21 bilateral and 6 midline tracts from the Johns Hopkins University (JHU) white matter parcellation atlas (Mori et al., 2005). FA values used for analyses were obtained by calculating tract-wise means from the intersection of the atlas and the individual FA skeletons generated using TBSS (see subsection MRI Data Acquisition and Processing for details).

