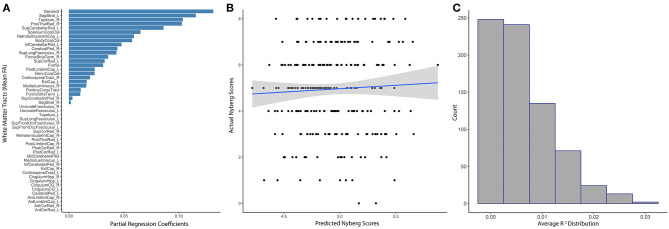
Figure 3.
Distributed white matter tract integrity and Nyberg Health Index scores. (A) The absolute value of partial regression coefficients for each tract that remained non-zero after training the initial elastic net model predicting Nyberg Health Index scores. (B) Scatter plot showing the correlation between model-predicted and actual Nyberg Health Index scores (R2 = 0.0025, p = 0.44). (C) Distribution of R2s gathered from the subsequent ensemble modeling using 1,000 iterations of the elastic net model, which did not reveal any non-zero tracts (Ensemble R2 = 0.0062, 25th−75th quartile = 0.0001–0.008). Sex was included as a covariate in all modeling.

