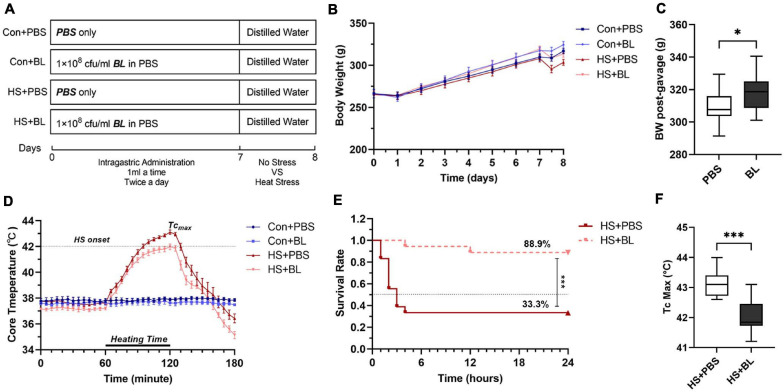
FIGURE 1.
Experimental design and effects of Bacillus licheniformis (BL) on weight, core body temperature (Tc), and survival rate of rats with heat stroke (HS). (A) The BL group was administered 1 × 10⁸ CFU BL each twice a day for 7 days. After gavage, the HS model was induced by placing rats in an artificial climate chamber with Ta maintained at 40°C ± 1 and RH at 65% until the Tc of rats was beyond 42°C for approximately 60 min. (B) Body weight (BW) changes recorded every day are expressed from the starting gavage day. HS experiments were conducted just after the gavage stage, and pre-heating and post-heating BW were measured at day 7.5. (C) BW of post-gavage in the PBS groups was compared with BW in the BL groups. (D) Core body temperature (Tc, °C) was plotted for every 5 min from 1 h before heating to 1 h after heating. (E) Survival was monitored for 24 h after HS onset. (F) The maximum Tc in HS + PBS was compared with Tc Max in HS + BL. Data of Con + PBS (dark blue line with square), Con + BL (light blue line with circle), HS + PBS (dark red line with upright triangle), and HS + BL (light red line with inverted triangle) are plotted in (B,D,E). Data in (B,D) are presented as the mean ± SEM of eight rats per group. Data in (C,F) are presented as a box-and-whisker plot of eight rats per group. Eighteen rats in each HS group were used for the survival study. ∗P < 0.05, ∗∗∗P < 0.001.

