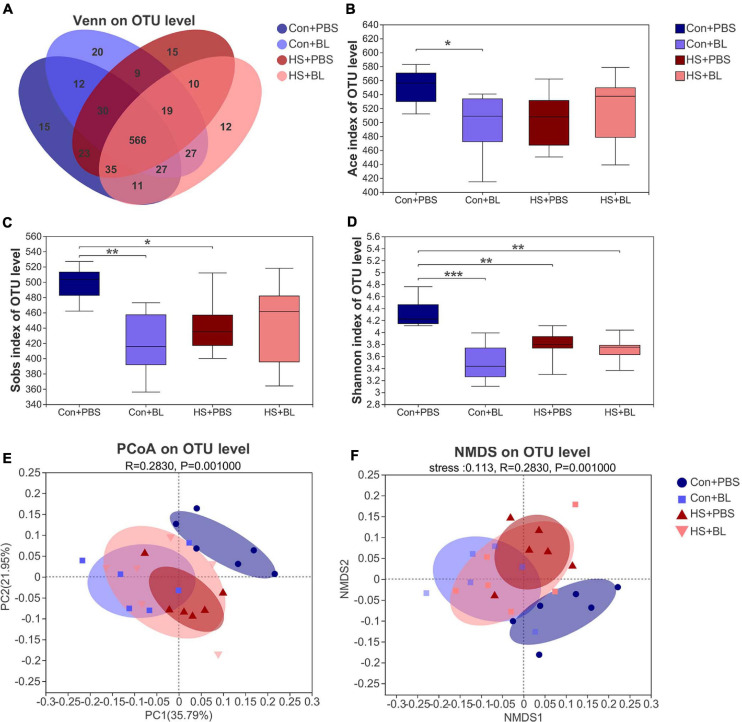
FIGURE 5.
BL pre-administration and HS induction modulated the overall structure of gut microbiota of rats according to analysis of α-diversity and β-diversity. (A) Venn diagram of the operational taxonomic unit (OTU) distribution shows unique and shared OTUs between different experimental groups (n = 4). The Ace (B), Sobs (C), and Shannon (D) indexes of α-diversity analysis at the OTU level were calculated and compared among four groups. (E,F) β-Diversity was calculated by multivariate statistical analysis including principal coordinate analysis (PCoA), non-metric multidimensional scaling analysis (NMDS), and analysis of similarities (ANOSIM) at the OTU level based on weighted unifrac analysis, indicating significantly different gut microbiota structures among the four groups (ANOSIM, R = 0.283, P = 0.001). Data (B–D) are presented as a box-and-whisker plot of six rats per group. *P < 0.05, **P < 0.01, ***P < 0.001.

