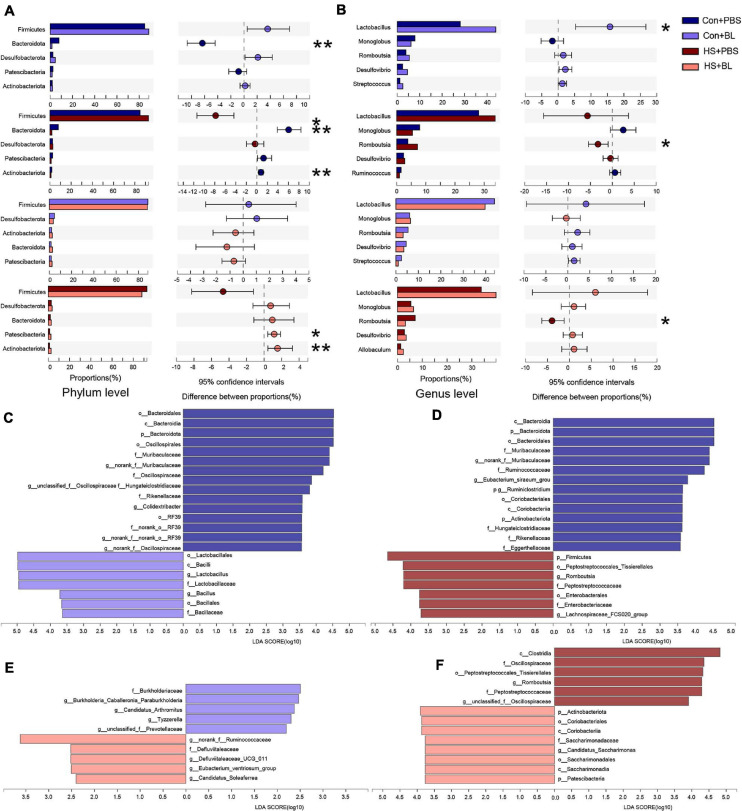
FIGURE 7.
Pairwise comparisons of gut microbiota compositions between each group. (A,B) Mean relative abundances of the five most abundant phyla and genera (non-ranked or unclassified types were excluded) are shown by extended error bar plot and were compared between two groups at the phylum and genus levels. (C–F) Gut microbiota comparisons from phylum to genus between two groups by linear discriminant analysis effect size (LEfSe) analysis. Linear discriminant analysis (LDA) scores for the differentially abundant bacterial taxa between two groups were calculated by LEfSe to assess the effect size of each differentially abundant taxon. Only taxa having a p-value < 0.05 and LDA > 3.5 are shown in (C,D,F), except (E) uses LDA > 2.0 due to the subtle difference in this comparison. Only taxa meeting an LDA significance threshold of 2 were included and shown. Enriched taxa in each group are indicated in red or blue. n = 6 in each group. *P < 0.05, **P < 0.01.

