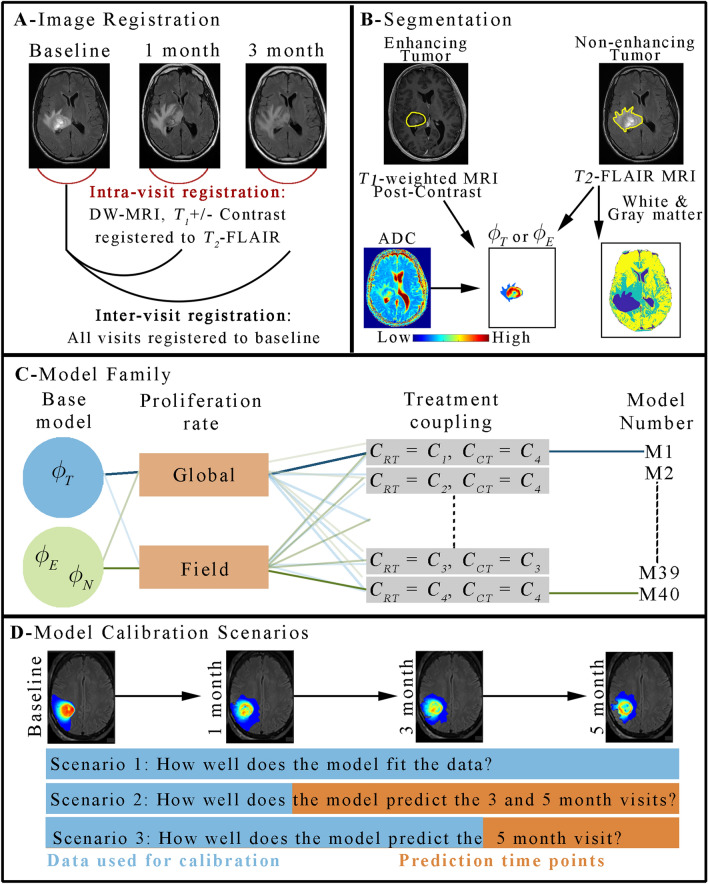
Figure 1.
Schematic of the image processing and computational methods. Panel (A) shows the approach to image registration where all images first receive an intra-visit registration to align all images within a single visit prior to an inter-visit registration to the baseline time point. Panel (B) shows the expertly segmented contrast-enhancing and non-enhancing (T2 hyperintense) tumor regions which are used as ground truth of enhancing tumor and non-enhancing clinical tumor volumes, respectively. DWI measurements of ADC are then used to estimate ϕT and ϕE, while ϕN is set to a fixed value within the clinical tumor volume. The T2-FLAIR image is also used to provide a segmentation of white, gray, and cerebral spinal fluid tissues. Panel (C) shows our framework for constructing models. A family of models are built upon either a single-species (ϕT) or two-species (ϕE and ϕN) reaction–diffusion model. The proliferation rate is either assigned globally or as a field, and there are 10 approaches to spatially vary the efficacy of RT and CT resulting for a total of 40 models. Finally, panel (D) shows the three calibration scenarios to evaluate model fits, long-term model “forecasts”, and short-term model “forecasts”, respectively. MATLAB R2019b (Mathworks, Natick, MA) was used for producing individual figures, images, and graphs. Adobe Photoshop 2020 (Adobe, San Jose, CA) was used to arrange individual panels, draw schematics, and add text.

