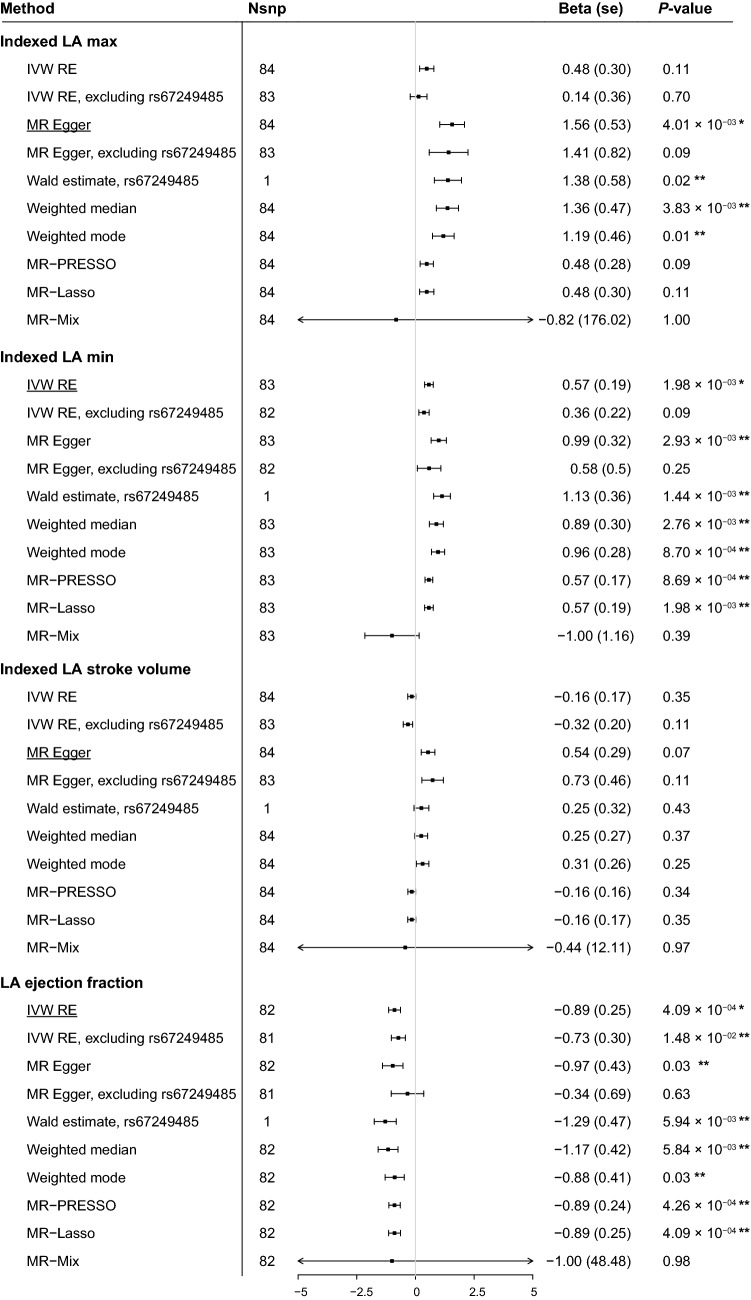
Figure 1.
Summary MR estimates of the causal association between AF and LA size and function. The figure displays the MR estimates on the association between AF and body surface area indexed left atrial maximal volume (LA max), minimal volume (LA min), stroke volume and ejection fraction. Inverse-variance-weighted (random effects) model, MR-Egger, MR pleiotropy residual sum and outlier (MR-PRESSO), weighted median, weighted mode-based estimator and MR-Mix are shown. Outlier-corrected MR-PRESSO estimates are not included, since no genetic variants were removed in the MR-PRESSO analyses. On the X-axis, the beta coefficient and its upper and lower bound standard error are shown. The main analyses, i.e. inverse-variance-weighted random effects under the scenario of balanced horizontal pleiotropy or MR-Egger estimate under the scenario of unbalanced horizontal pleiotropy, are underlined per outcome. We considered a stringent two-sided Bonferonni corrected P < 0.05/7 outcomes statistically significant for the main analyses. Significant results for the main analysis are annotated with a single asterisk (*). A P-value threshold of P < 0.05 was adopted for the sensitivity MR analyses. Significant sensitivity MR analyses are annotated with a double asterisk (**). SE denotes standard error. The plot was made using the forestplot package (version 1.10.1, https://CRAN.R-project.org/package=forestplot) in R (version 3.6.3)59.

