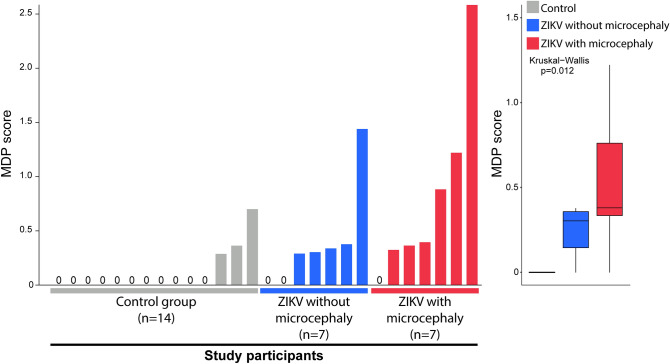
Figure 2.
Children that developed microcephaly exhibit higher molecular degree of perturbation in CSF. Left panel: Histograms show the single sample molecular degree of perturbation (MDP) score values relative to each study group as indicated. MDP values were calculated as described in Methods and in Oliveira-de-Souza et al.36. Right panel: Box plots represent the distribution of the MDP among study groups. Values were compared among the control, ZIKV-exposed with or without microcephaly groups using the Kruskal–Wallis test with Dunn’s multiple comparisons. All the differences between the groups were statistically different (p < 0.05). In the box plots, lines represent median and interquartile range values.

