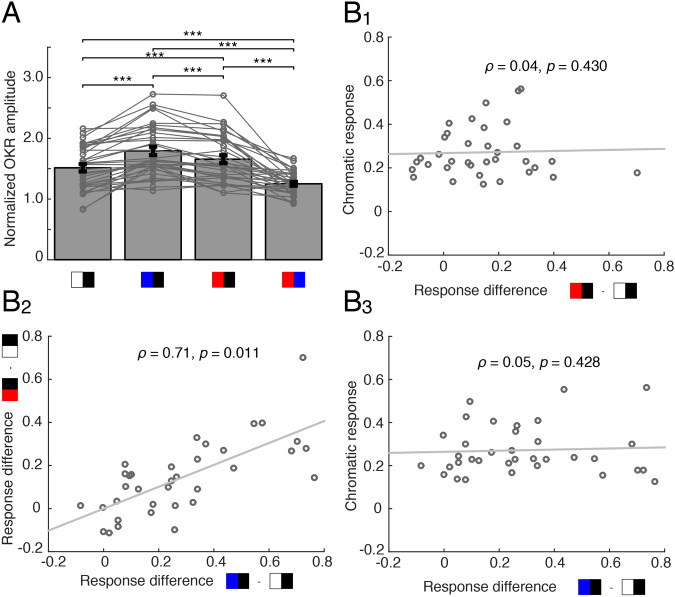
Figure 3.
Color-dependent differential OKR performance of semi-intact preparations of Xenopus tadpoles. (A) Bar plot depicting the relative OKR amplitude for large-field visual motion stimuli with different color combinations; note the larger responses when black stripes were paired with blue or red compared to black–white stripes; ***, p < 0.0001 (n = 34; Mann–Whitney U-test). (B) Scatter plot depicting relative chromatic response (OKR amplitude at POE; see “Methods”) magnitudes (n = 34 animals) as function of the difference in amplitude between the conditions: red–black and white–black (B1) and blue–black and white–black (B3); (B2) illustrates the difference in response magnitudes between blue–black and white–black (x-axis) and red–black and white–black (y-axis); despite the mathematical coupling, there is a significant correlation between blue/white and red/white response magnitudes (expected correlation due to coupling: ρ = 0.48). Figure assembled with Affinity Designer (version 1.8.3).

