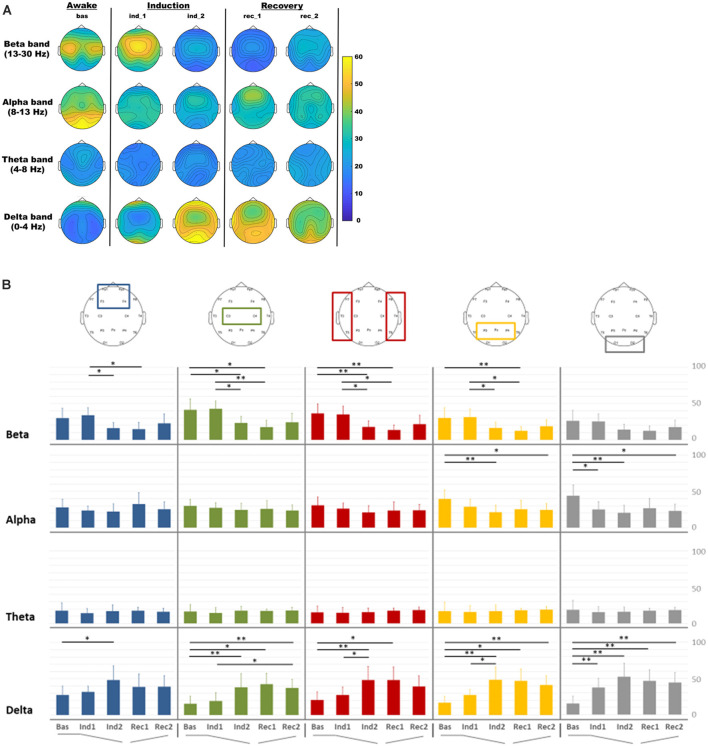
Figure 2.
Electroencephalography (EEG) relative power distribution for delta, theta, alpha, and beta bands in each condition. (A) EEG relative power maps. (B) EEG relative spectral power comparisons among regions of interest (ROIs) for each band analyzed in each condition: baseline (Bas), beginning phase of administration of propofol (Ind1), loss of consciousness (Ind2), propofol infusion stopped (Rec1) and pre-recovery of consciousness (Rec2) period for frontal (blue), central (green), temporal (red), parietal (orange) and occipital (gray) ROIs. *p < 0.05; **p < 0.01.

