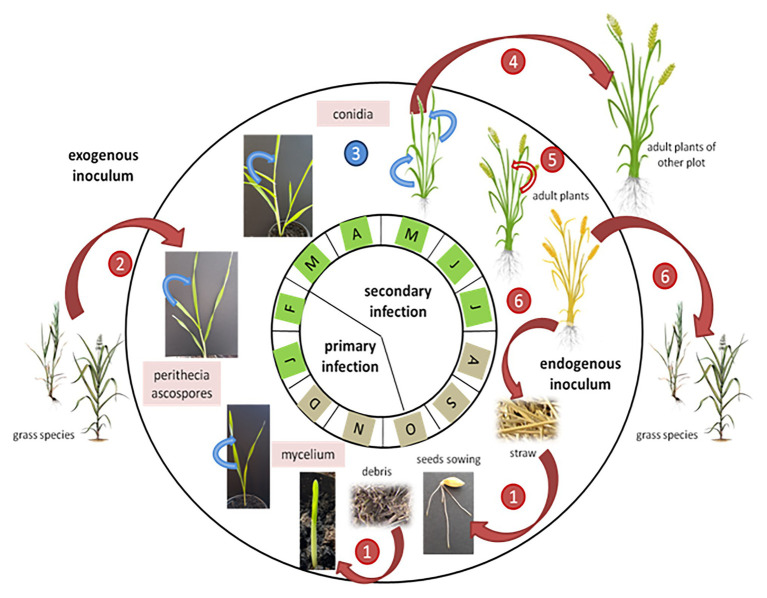
Figure 4.
Dynamics of net blotch epidemics adapted from Suffert et al. (2011). Red arrows indicate P. teres wind-dispersed infections and blue arrows indicate splash-dispersed infections. The months with a brown color indicate that the source of inoculum comes from swarming debris on the soil, while the months with a green color indicate a source of inoculum mainly from the aerial parts of the plants. The numbers indicate the pathogen’s infection stages: 1: infection by P. teres ascospores present on infected barley debris; 2: mycelium present on grass species infects barley young plants; 3: the net blotch disease progresses from the bottom to the top of the barley plant; 4: disseminated by the wind, conidia contaminate other barley plants; 5: heavily infected crops show abortion of the ear; and 6: Pyrenophora teres colonizes the senescent tissues and produces perithecia on straw and grass species.

