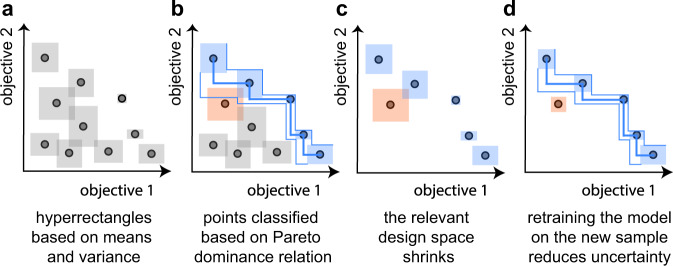
Fig. 4. Illustration of the working principle of the ϵ-PAL algorithm.
a For each point, we construct hyperrectangles around the mean μ (coming from either from the model predictions or the measurement) with widths proportional to the uncertainty σ (which is the SD of the posterior of the points we did not sample yet and the estimated uncertainty of the measurement for the sampled points; the exact width of the uncertainty hyperrectangles is also a function of the hyperparameters and the iteration). b Using the ϵ-Pareto dominance relation, we can identify which points can be discarded with confidence and which are with high-probability Pareto optimal. c After this classification, the design space that is relevant for search is smaller and we can sample the largest hyperrectangle to reduce uncertainty (the orange one in this case). d After performing the simulations for the sampled material (orange), the model uncertainties decrease, notably in the neighborhood region of the sampled material.

