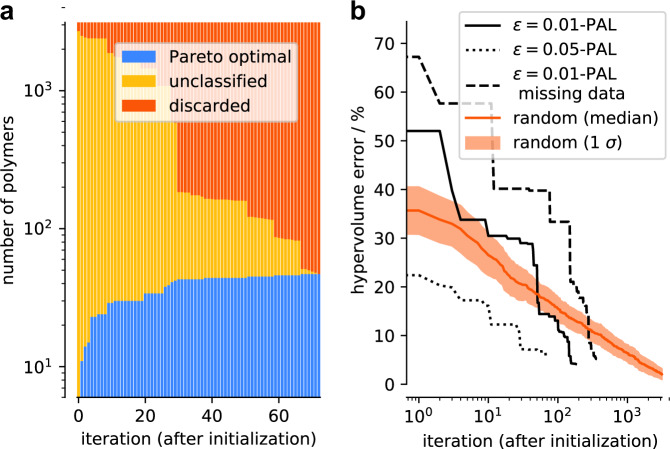
Fig. 6. Classified points and hypervolume error as a function of the number of iterations.
a The ϵ-PAL algorithm classifies polymers after each learning iteration with ϵi = 0.05 for every target and a coregionalized Gaussian process surrogate model. The Gaussian process model was initialized with 60 samples that were selected using a greedy farthest point algorithm within feature space. It is noteworthy that the y-axis is on a log scale. b Hypervolume errors are determined as a function of iteration using the ϵ-PAL algorithm with ϵi = 0.01 and 0.1 for every target. A larger ϵi makes the algorithm much more efficient but slightly degrades the final performance. For ϵi = 0.01, we intentionally leave out a third of the simulation results for ΔGrep from the entire dataset. The method for obtaining improved predictions for missing measurements with coregionalized Gaussian process models is discussed in more detail in Supplementary Note 7. Hypervolume error for random search with mean and SD error bands (bootstrapped with 100 random runs) is shown for comparison. For the ϵ-PAL algorithm, we only consider the points that have been classified as ϵ-accurate Pareto optimal in the calculation of the hypervolume (i.e., with small ϵ, the number of points in this set will be small in the first iterations, which can lead to larger hypervolume errors). All search procedures were initialized using the same set of initial points, but vary substantially after only one iteration step due to the different hyperparameter values for ϵ. It is noteworthy that the x-axis is on a log scale. Overall, the missing data increase the number of iterations that are needed to classify all materials in the design space.

