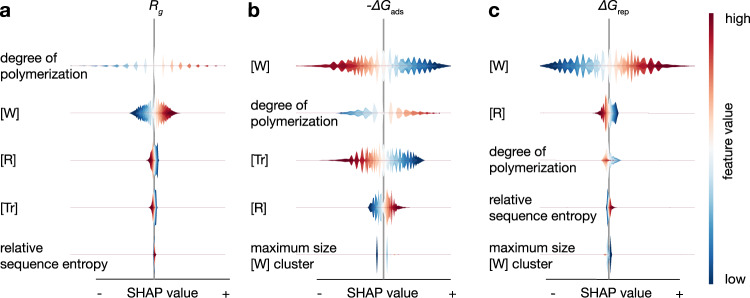
Fig. 7. Influence of the feature values on the predictions.
SHAP summary plots for the models for our three objectives based on the models obtained after running the ϵ-PAL algorithm in Fig. 6. a SHAP summary plot for the radius of gyration. b SHAP summary plot for the adsorption energy. c SHAP summary plot for the dimer repulsion energies. We used all the sampled points from the run of the ϵ-PAL algorithm as background data for the SHAP analysis. Red points correspond to a high feature value, whereas blue points correspond to low feature values. The width of the violin shown on the x-axis corresponds to the density of the distribution of SHAP values and indicate how the features impact the model output. A negative SHAP value means that the specific feature value decreases the predicted value, with respect to the baseline prediction. SHAP values were computed for a coregionalized model with a Matérn-5/2 kernel and ϵ = 0.05.

