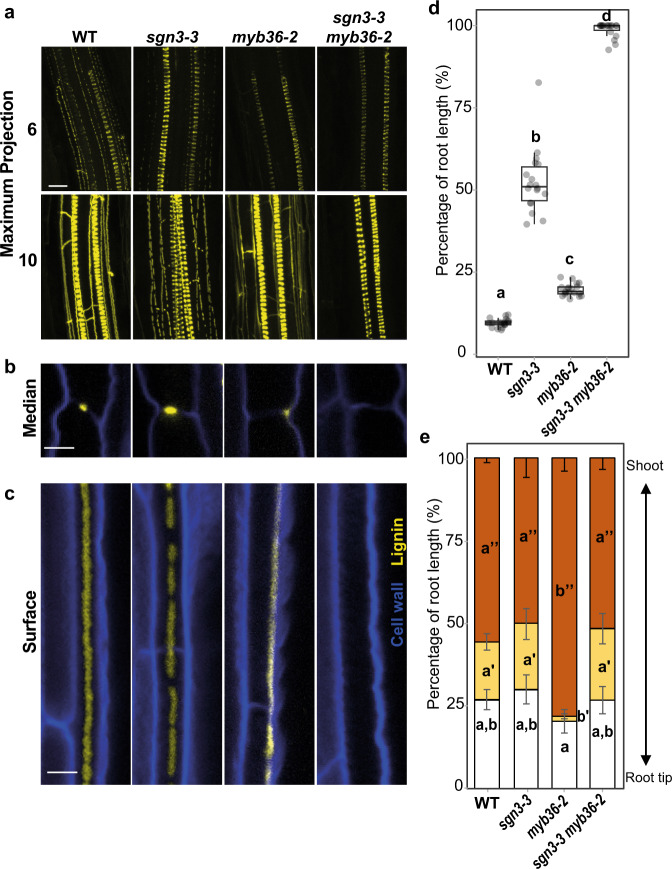
Fig. 1. Disruption of MYB36 and SGN3 abolishes endodermal lignification and root apoplastic barrier.
a Maximum projection of lignin staining at the sixth and tenth endodermal cell after the onset of elongation. Spiral structures in the centre of the root are xylem. Scale bar = 10 µm. Median (b) and surface (c) view of an endodermal cell at ten cells after the onset of elongation. Scale bar = 5 µm. The roots were cleared and stained with basic fuchsin (yellow) for lignin and with Calcofluor white (blue) for cellulose. The experiment was repeated three times independently with similar results. d Boxplot showing the percentage of the root length permeable to propidium iodide. n = 18 from two independent experiments. Different letters represent significant differences between genotypes using a two-sided Mann–Whitney test (p < 0.01). Centre lines show the medians; box limits indicate the 25th and 75th percentiles. e Quantification of suberin staining along the root. The results are expressed in percentage of root length divided in three zones: unsuberized (white), discontinuously suberized (yellow), continuously suberized (orange). n = 5 plants for WT, n = 6 plants for sgn3-3, n = 7 plants for myb36-2 and n = 7 plants for sgn3-3 myb36-2, error bars: SD, the centre of the error bars represents the mean. Individual letters show significant differences using a two-sided Mann–Whitney test between the same zones (p < 0.01). The experiment was repeated two times independently with similar results.

