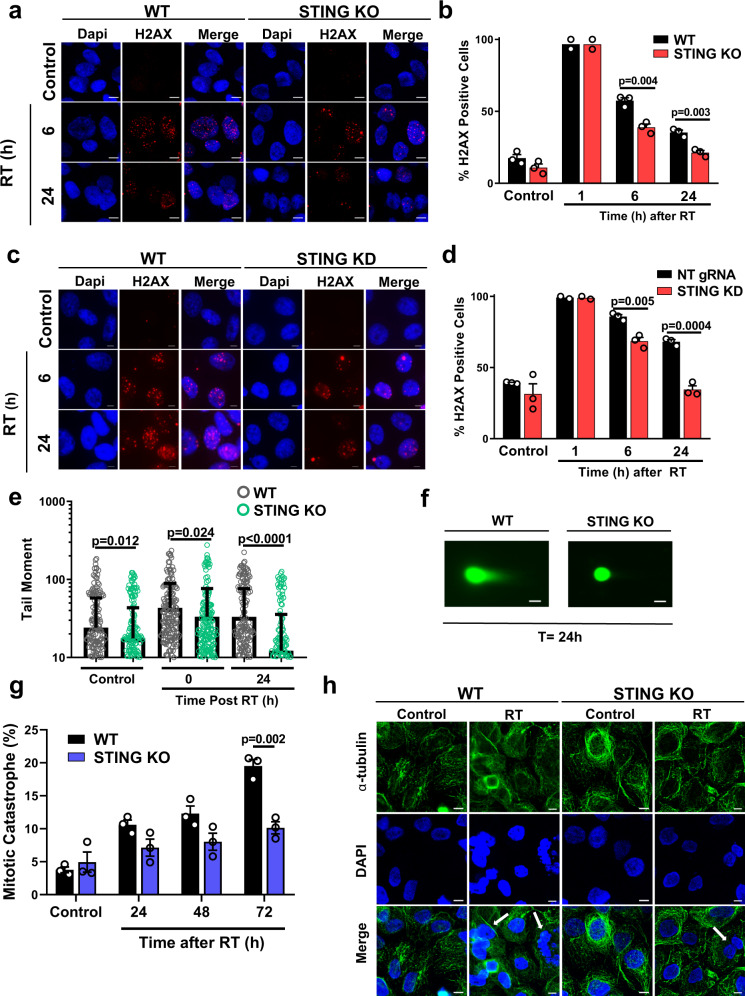
Fig. 3. STING loss reduces radiation-induced DNA damage.
Representative images (a) and quantification (b) of radiation-induced γH2AX foci in WT and STING KO FaDu cells at the indicated times after RT (1 Gy × 4). Representative images (c) and quantification (d) of radiation-induced γH2AX foci in WT and STING KD Detroit562 cells at the indicated times after RT (1 Gy × 4). In a and c scale bares are 10 μm. In b and d error bars represent SEM from 2 (1 h post RT) or 3 (0 Gy, 6 and 24 h post RT) independent experiments, analyzed by unpaired, two-tailed t-tests without multiple comparison correction. Quantification (e) and representative images (f) of neutral comet assay foci performed in WT and STING KO FaDu cells at the indicated times after RT. Error bars in e represent SD for at least 195 cells from three independent experiments, scale bar is 30 μm, analyzed by unpaired, two-tailed t-tests without multiple comparison correction. Quantification (g) and representative images (h) of radiation-induced mitotic catastrophe in WT and STING KO FaDu cells at the indicated times after RT (1 Gy × 4). Arrows highlight examples of cells with multiple distinct nuclear lobes, a marker of mitotic catastrophe. Error bars represent SEM from three independent experiments, scale bar is 10 μm, analyzed by unpaired two-tailed t-test with Bonferroni–Sidak multiple comparison correction.

