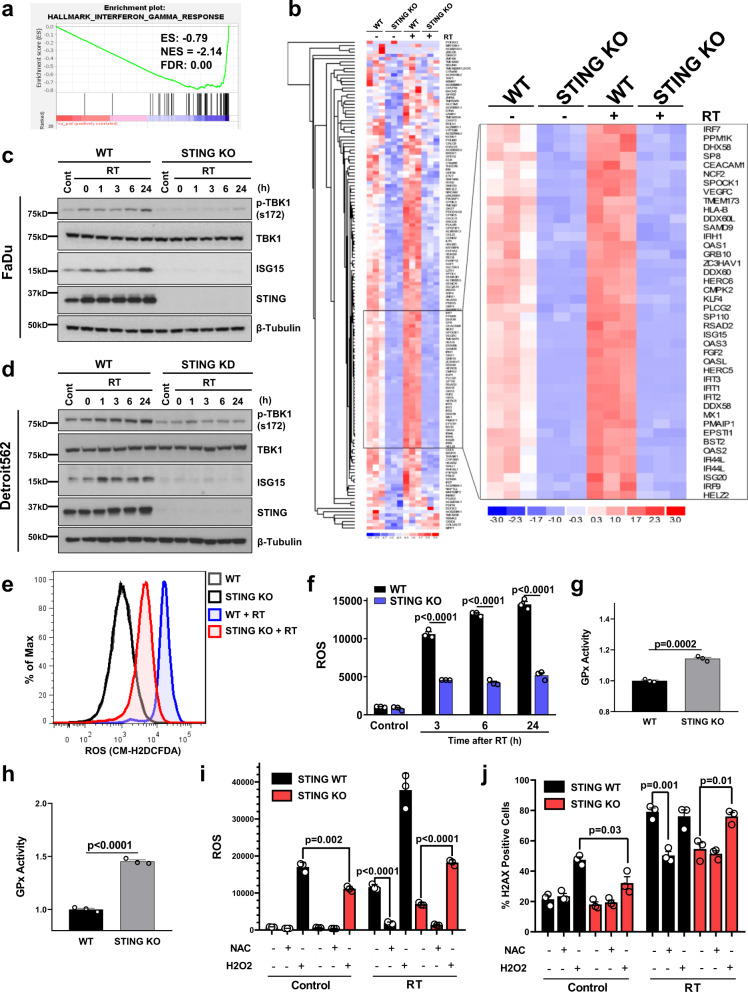
Fig. 4. STING loss alters the cellular transcriptome and ROS homeostasis.
a Gene set enrichment analysis (GSEA) plot of Hallmark IFNγ response in FaDu WT and STING KO cells. b Heatmap of the top 150 significantly downregulated genes in STING KO cells compared with WT. The inset identifies several critical genes in the ROS and ISG15 pathway with inhibited expression at baseline and prevention of radiation-induced expression. Immunoblots in FaDu (c) and Detroit562 cells (d) examining baseline and radiation-induced STING pathway activation for STING-regulated genes identified by RNA-Seq analysis. Immunoblots are representative of two independent experiments. Representative curves (e) and quantification (f) of flow cytometry-based analysis of ROS (measured by CM-H2DCFDA) in FaDu WT and STING KO cells. Error bars represent SEM from three independent experiments, analyzed by unpaired, two-tailed t-test without multiple comparison correction. Analysis of glutathione peroxidase (GPx) activity in FaDu WT and STING KO cells at baseline (g) and after radiation (h). In g and h error bars represent SEM from three independent experiments, analyzed by unpaired, two-tailed Student’s t test. i Flow cytometry-based analysis of ROS (measured by CM-H2DCFDA) in FaDu WT and STING KO cells treated with NAC (2 mM) or H2O2 (10 μM), or 6 h after RT (2 Gy × 4). Error bars represent SD from three independent experiments, analyzed by unpaired, two-tailed t-test. j Analysis of γH2AX foci in WT and STING KO FaDu cells treated with NAC (2 mM) or H2O2 (10 μM), or 6 h after RT (1 Gy × 4). Error bars represent SEM from three independent experiments, analyzed by unpaired, and two-tailed t-test without multiple comparison correction.

