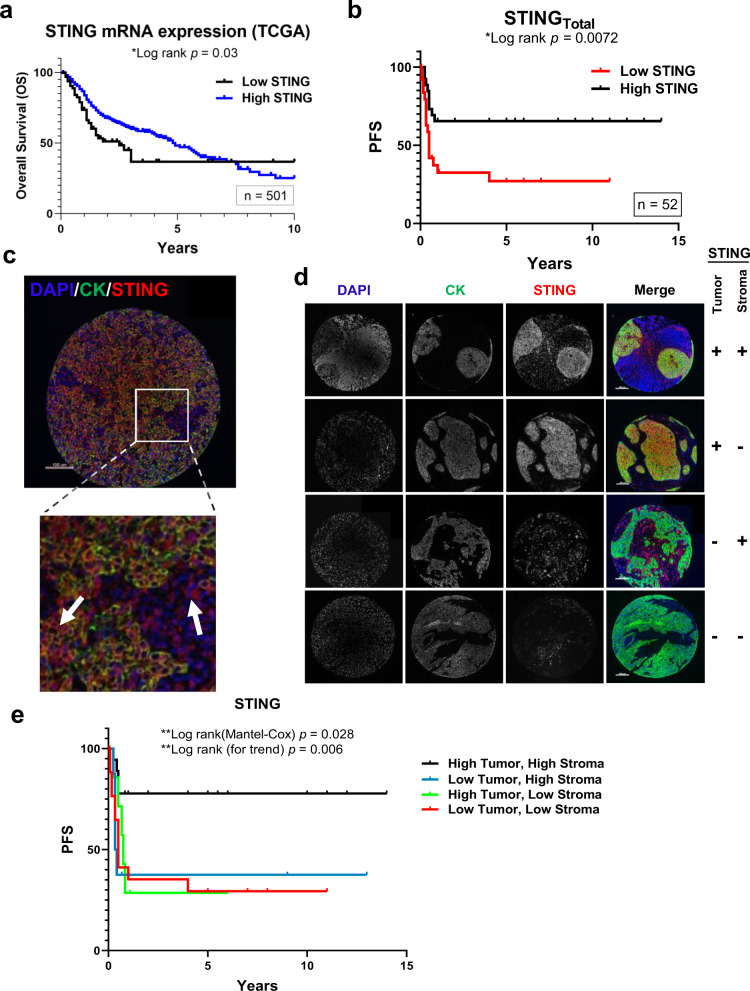
Fig. 5. STING expression and outcomes in HNSCC.
a Kaplan–Meier curves of HNSCC TCGA cohort stratified by STING mRNA expression (low vs high). b Kaplan–Meier curves of patients stratified by total STING expression (low vs high). c Representative images of TMA spot from b stained for DAPI, cytokeratin (tumor mask), and STING. Arrows indicated STING staining in both compartments (tumor and stroma). d Representative images of TMA spots illustrating grouping of TMA specimens into four groups based upon compartmental STING expression. Each patient specimen was stained once due to lack of material, with images representative of their respective groups: b (from entire patient cohort) or d (groups defined in e). e Kaplan–Meier curves of patients stratified by four groups identified in d. All statistical analysis was performed by log-rank testing with P-values as indicated in graphs. Scale bars are 100 μm in c and d.

