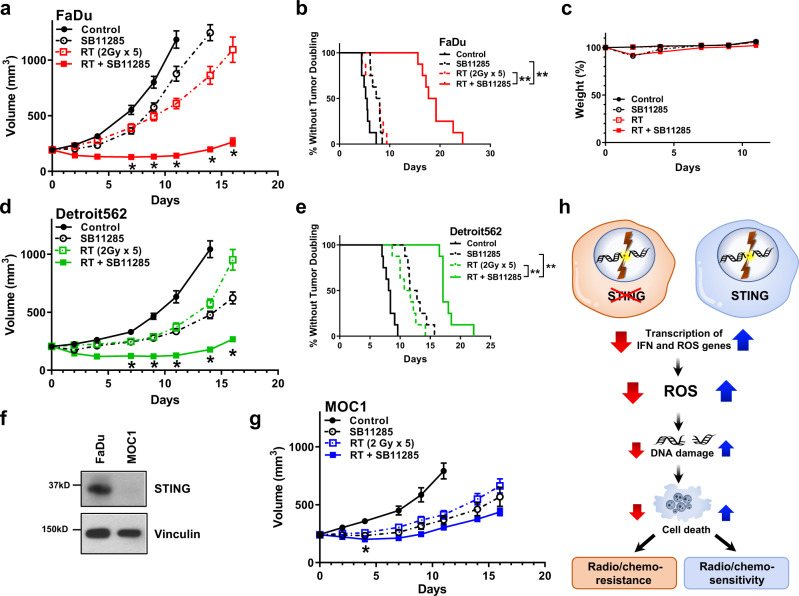
Fig. 6. Novel STING agonist SB11285 enhances in vivo response to radiation therapy.
a FaDu tumor growth curves for each treatment group. Error bars represent the SEM of n = 8 mice per treatment group; *P-values for 7, 9, 11, 14, and 16 days are 0.0007, 0.0003, 0.0002, 0.0007, and 0.002 (RT + SBP11285 compared to RT) based on two-way ANOVA with Sidak post-hoc multiple comparison correction. b Kaplan–Meier curves of percent tumors without tumor doubling (400 mm3). Statistical analysis was performed by log-rank testing (n = 8 per treatment group), with **P < 0.0001. c Weight as stratified by treatment group (n = 8 mice per group). d Detroit 562 growth curves for each treatment group. Error bars represent the SEM of n = 8 mice per treatment group; *P-values for 7, 9, 11, 14, and 16 days are 0.001, 0.002, 0.002, 0.0002, and 0.002 (RT + SBP11285 compared to RT) based on two-way ANOVA with Sidak post-hoc multiple comparison correction. e Kaplan–Meier curves of percent tumors without tumor doubling (400 mm3). Statistical analysis was performed by log-rank testing (n = 8 per treatment group), with **P < 0.0001. f Western blots of STING expression in FaDu and MOC1 cells and are representative of two independent experiments. g MOC1 tumor growth curves for each treatment group. Error bars represent the SEM of n = 6 mice per treatment group; *P = 0.03 (RT + SBP11285 compared to RT) based on two-way ANOVA with Sidak post-hoc multiple comparison correction. h Proposed model of tumor intrinsic STING loss leading to treatment resistant phenotype.

