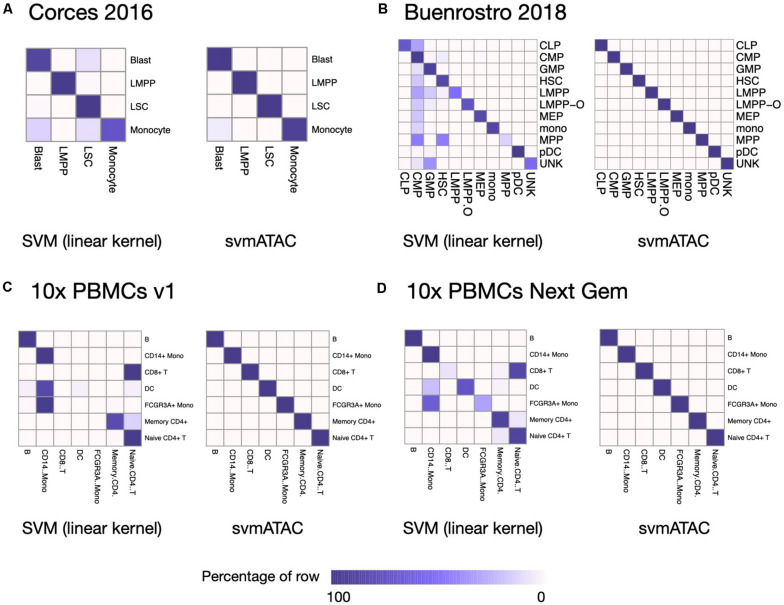
FIGURE 2.
Heatmap comparing the SVM (linear kernel) and svmATAC predicted cells versus true label of intra-dataset experiment. (A) The experiment on Corces2016. In monocyte, the percentage of correctly predicted cells by svmATAC is increased the most, by 19.79% (from 75 to 94.79%), while the percentage of LSC is increased the least, by only 0.52% (from 98.96 to 99.48%), compared to SVM (linear kernel). (B) The experiment on Buenrostro2018. All cells are correctly classified by svmATAC, and the percentage of correctly predicted cells in all population increase by at most 86% in MPP, compared to the SVM (linear kernel). (C) The experiment on 10× PBMCs v1. All cells are correctly classified by svmATAC. The cells of CD8+ T and FCGR3A+ Mono, which are totally incorrectly classified by the SVM (linear kernel), are all correctly classified by svmATAC. (D) The experiment on 10× PBMCs Next Gem. All cells are correctly classified by svmATAC. The cells of CD8+ T, DC, and FCGR3A+ Mono, most of which are incorrectly classified by the SVM (linear kernel), are all correctly classified by svmATAC. Colors represent the percentages of cells of a specific reported type labeled as each type by svmATAC.

