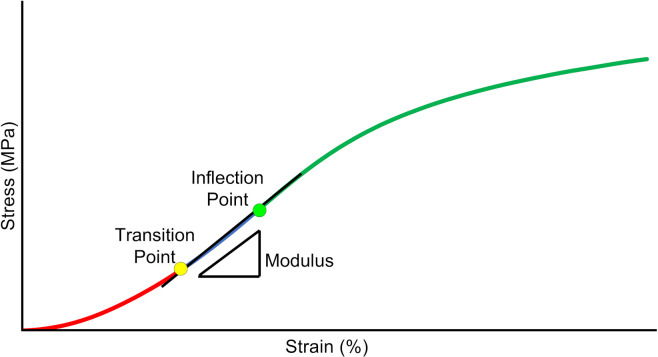
FIGURE 3.
Schematic of critical data derived from the Tanaka et al. (2011) analysis of the low-strain portion of the stress-strain curve. Inflection point, is where the curve transitions from stiffening to softening. Transition point, is where the curve transitions from an exponential curve to a linear curve. Modulus, is the slope of the curve between the transition and inflection point.

