
FIGURE 5.
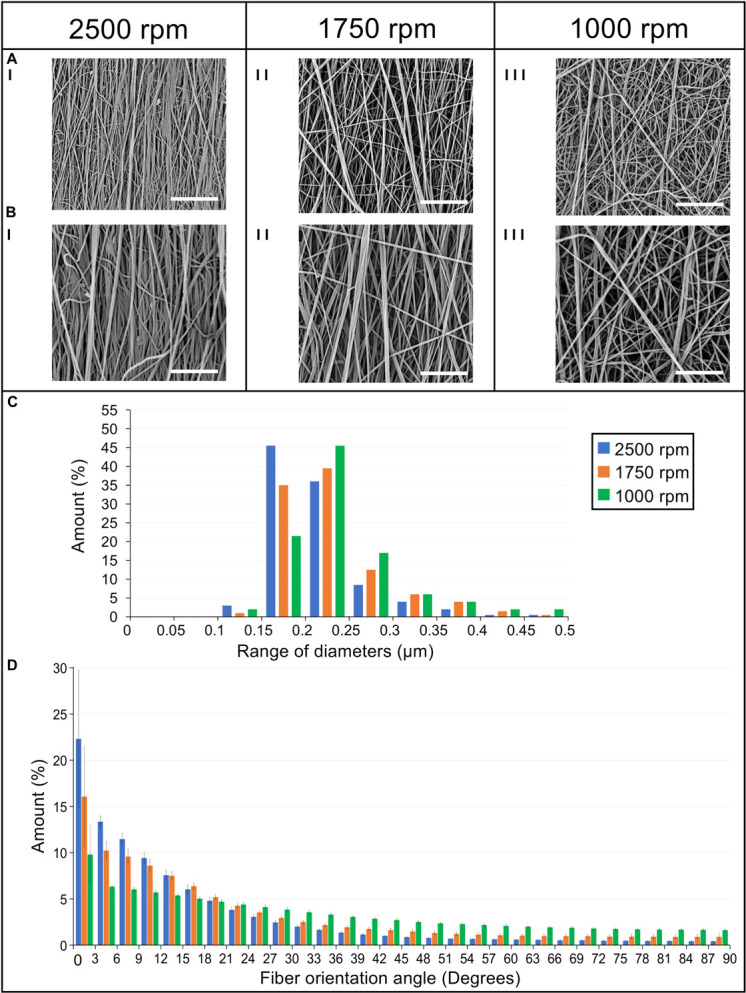
Morphological investigation of the bundles nanofibers. SEM images of the nanofibers at (I) 2,500 rpm, (II) 1,750 rpm, and (III) 1,000 rpm acquired at different magnifications: (A) 8,000× (scale bar = 10 μm); (B) 15,000× (scale bar = 5 μm). (C) Diameter distribution of the nanofibers in terms of percentage for the different ranges of diameters for the 2,500 rpm (blue bars), 1,750 rpm (orange bars), and 1,000 rpm (green bars). (D) Orientation analysis of the nanofibers in which an angle of 0° corresponds to the longitudinal axis of the specimen while an angle of 90° corresponds to the circumferential direction. The directionality histograms show the distribution in terms of percentage (mean and standard deviation) of nanofibers for the different ranges of angles for the 2,500 rpm (blue bars), 1,750 rpm (orange bars), and 1,000 rpm (green bars).