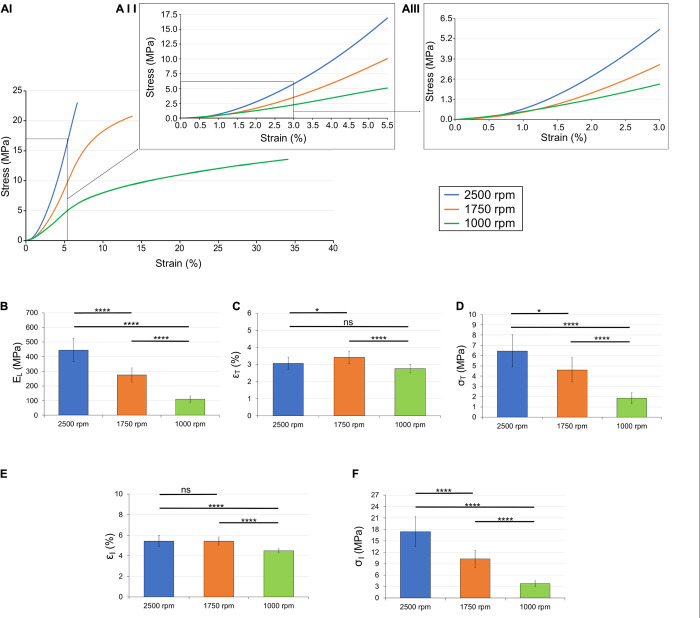
FIGURE 6.
Mechanical behavior of the different bundles categories: (AI) overlay of the typical stress-strain curves; (AII) zoom-in up to the inflection points; (AIII) zoom-in up to the transition points. Comparison between the mechanical properties of the bundles: (B) linear region modulus; (C) transition strain; (D) transition stress; (E) inflection strain; and (F) inflection stress. The mean and standard deviation are represented for each group. The statistical significance of differences is indicated (*p ≤ 0.05, **p ≤ 0.01, ***p ≤ 0.001, ****p < 0.0001, and ns, not significant).

