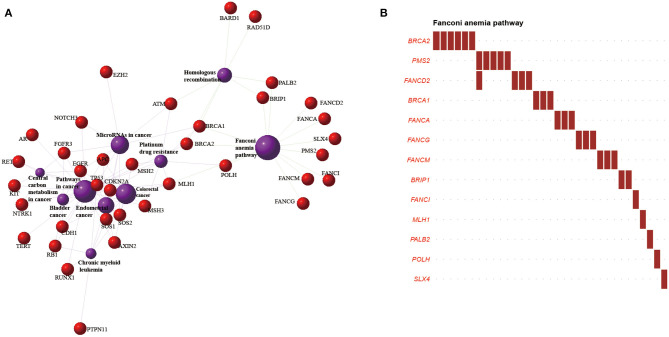
Figure 4.
Significantly enriched pathways and networks in esophageal squamous cell cancer (ESCC). (A) The network composed of genes involved in the top 10 pathways in the Kyoto Encyclopedia of Genes and Genomes pathway enrichment. The red dots represent genes, and the purple circles represent pathways. The larger the area, the higher the degree of enrichment. The different lines represent various categories of pathways; green lines indicate genetic information processing, and purple lines indicate human disease. (B) The y-axis represents cancer susceptibility genes mutated in the Fanconi anemia pathway; the x-axis represents the number of patients affected in our cohort. Red font: tumor-suppressor genes.

