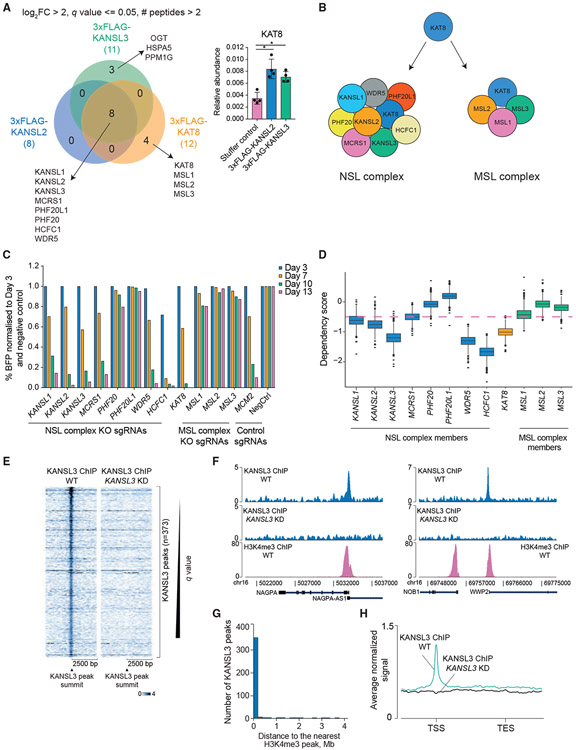
Figure 1. The NSL complex is essential for cell survival and predominantly localizes to transcription start sites.
(A) Venn diagram of KANSL2, KANSL3, and KAT8 interactors (log2 fold enrichment over untagged cell line > 2, minimum two peptides identified per protein, and q ≤ 0.05). KAT8 did not reach the selected enrichment threshold in the KANSL2 and KANSL3 immunoprecipitations but was significantly enriched over the untagged cell line (bar blot; values are shown as mean ± SD). *q ≤ 0.05.
(B) NSL and MSL complex composition in human cells.
(C) CRISPR KO competition assays testing essentiality of the NSL and MSL complex subunits. Cutting efficiency of all sgRNAs was verified using Sanger sequencing with subsequent sequence trace decomposition.
(D) Boxplot describing distribution of the DepMap dependency scores for the NSL and MSL complex subunits. Genes with dependency scores ≤ −0.5 are considered essential (pink dashed line).
(E) Heatmaps of normalized KANSL3 ChIP-seq signal at 5,000 bp regions surrounding all significant KANSL3 peaks.
(F) Representative tracks of normalized KANSL3 and H3K4me3 ChIP-seq signals.
(G) Distribution of distances between KANSL3 peaks and the nearest H3K4me3 ChIP-seq peaks.
(H) Average normalized KANSL3 ChIP-seq signal across the genes nearest to KANSL3 peaks. TSS, transcription start site, TES, transcription end site.

