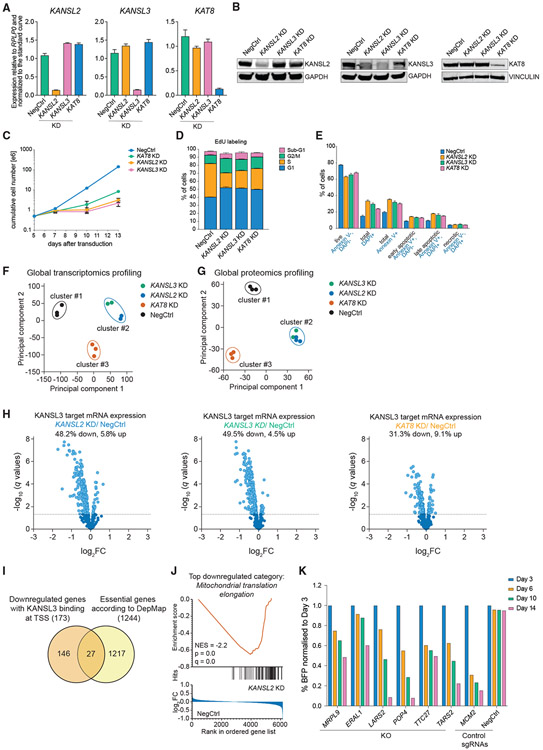
Figure 2. The NSL complex is required for expression of a subset of essential genes in human cells.
(A and B) qRT-PCR (A) and western blotting (B) analysis of KANSL2, KANSL3, and KAT8 expression 3 days after transduction of THP-1/cdCas9-KRAB cells with corresponding sgRNAs. In (A), values are normalized to RPLP0 and shown as mean ± SD.
(C) Growth curves of THP-1/cdCas9-KRAB cells transduced with a NegCtrl sgRNA or sgRNAs against KANSL2, KANSL3, or KAT8.
(D and E) Cell cycle (E) and apoptosis (F) analysis 7 days after KANSL2, KANSL3, or KAT8 KD. The values are shown as mean ± SD.
(F and G) Principal-component and non-hierarchical clustering analysis of the RNA-seq (F) and proteomics (G) expression data from NSL complex KD series.
(H) Volcano plots describing expression changes for all genes with a nearby KANSL3 ChIP-seq peak (KANSL3 targets) in NSL complex KD series. Differentially expressed genes are indicated in light blue (q < 0.05).
(I) Venn diagram indicating overlap between downregulated KANSL3 target genes and the list of pan-essential genes from the DepMap project.
(J) The gene set enrichment analysis (GSEA) enrichment plot for GO:0070125 gene set (mitochondrial translation elongation) on the basis of differential protein expression after KANSL2 KD.
(K) CRISPR KO competition assays for the selected NSL complex target genes.

