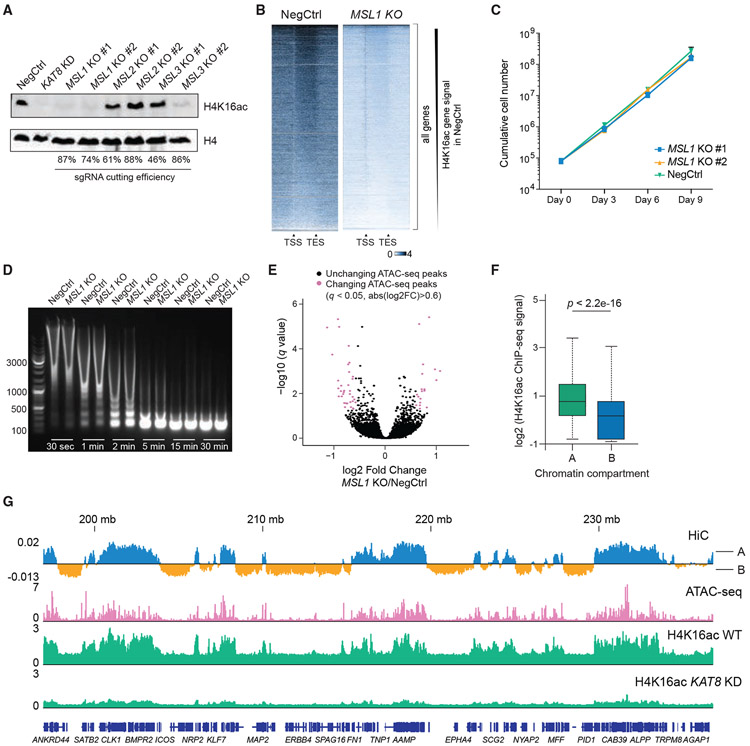
Figure 5. H4K16ac is associated with open chromatin but does not regulate chromatin accessibility in vivo.
(A) Western blot analysis of H4K16ac and H4 in THP-1/Cas9 cells transduced with sgRNAs targeting MSL complex members.
(B) Heatmaps of H4K16ac ChIP-seq signal at all genes in wild-type (NegCtrl) or MSL1-KO cells. The signal is normalized to the number of Drosophila reads (see STAR methods).
(C) Growth curves of THP-1/Cas9 cells transduced with a NegCtrl sgRNA or two independent sgRNAs against MSL1.
(D) Agarose gel electrophoresis image comparing chromatin digestion profiles of wild-type and MSL1-KO cells at different times after MNase addition.
(E) Volcano plot illustrating changes in ATAC-seq peaks after MSL1 KO in THP-1 cells.
(F) Boxplot summarizing H4K16ac ChIP-seq signal intensity in HiC-defined compartments A and B. p value was calculated using Wilcoxon rank-sum test.
(G) Example tracks demonstrating correlation between H4K16ac and open chromatin (ATAC-seq peaks and HiC-defined compartments A) in THP-1 cells.

