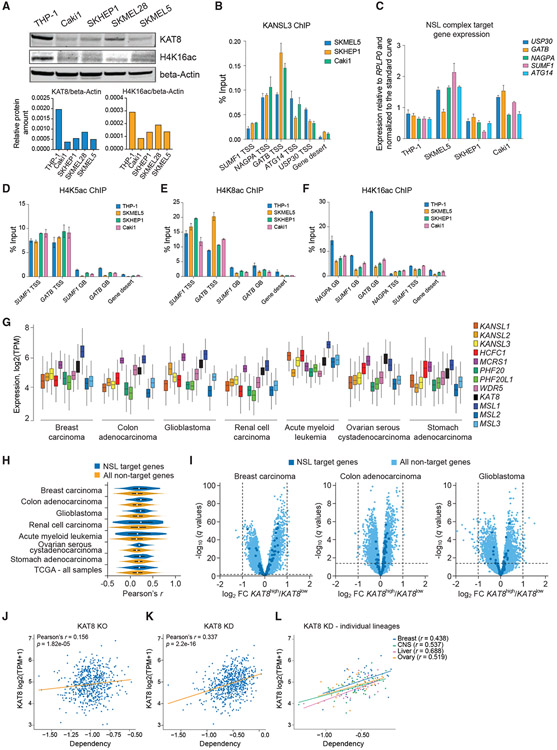
Figure 6. KAT8-low cancers retain NSL complex function but lose H4K16ac globally.
(A) Western blot analysis and quantitation of KAT8, H4K16ac, and beta-actin in THP-1, Caki1, SKHEP1, SKMEL28, and SKMEL5 cells.
(B) qRT-PCR quantitation of KANSL3 ChIP signal at a subset of NSL complex target TSSs in SKMEL5, SKHEP1, and Caki1 cells. Values are shown as mean ± SD.
(C) qRT-PCR gene expression analysis of a subset of NSL complex target genes in THP-1, Caki1, SKHEP1, and SKMEL5 cells. Values are normalized to RPLP0 and shown as mean ± SD.
(D–F) qRT-PCR analysis of H4K5ac (D), H4K8ac (E), and H4K16ac (F) ChIP signal at gene bodies (GBs) and TSS regions of a subset of NSL complex target genes in THP-1, SKMEL5, SKHEP1, and Caki1 cells. Values are shown as mean ± SD.
(G) Expression of the NSL and MSL complex members in different types of human cancer cells. Data are from The Cancer Genome Atlas.
(H) Vioplots demonstrating distribution of Pearson’s correlation coefficients (r) for KAT8 expression versus expression of 20,501 genes measured using RNA-seq in 10,433 cancer samples in The Cancer Genome Atlas for NSL complex target genes (as defined in THP-1 cells) and non-target genes.
(I) Volcano plots illustrating gene expression differences between the KAT8high and KAT8low human cancer samples (defined by median KAT8 expression) in the selected dataset from The Cancer Genome Atlas datasets.
(J and K) Scatterplots describing relationship between KAT8 expression level and cell sensitivity to KAT8 KO (J) defined using CRISPR KO (DepMap CERES dependency score) in 721 cancer cell lines or KAT8 KD (K) defined using RNAi (DepMap DEMETER2 dependency score) in 640 cancer cell lines. The robust Pearson’s correlation coefficient was calculated by bootstrapping 10% of the data.
(L) Scatterplot describing relationship between KAT8 expression level and cell sensitivity to KAT8 KD in selected cancer lineages.

