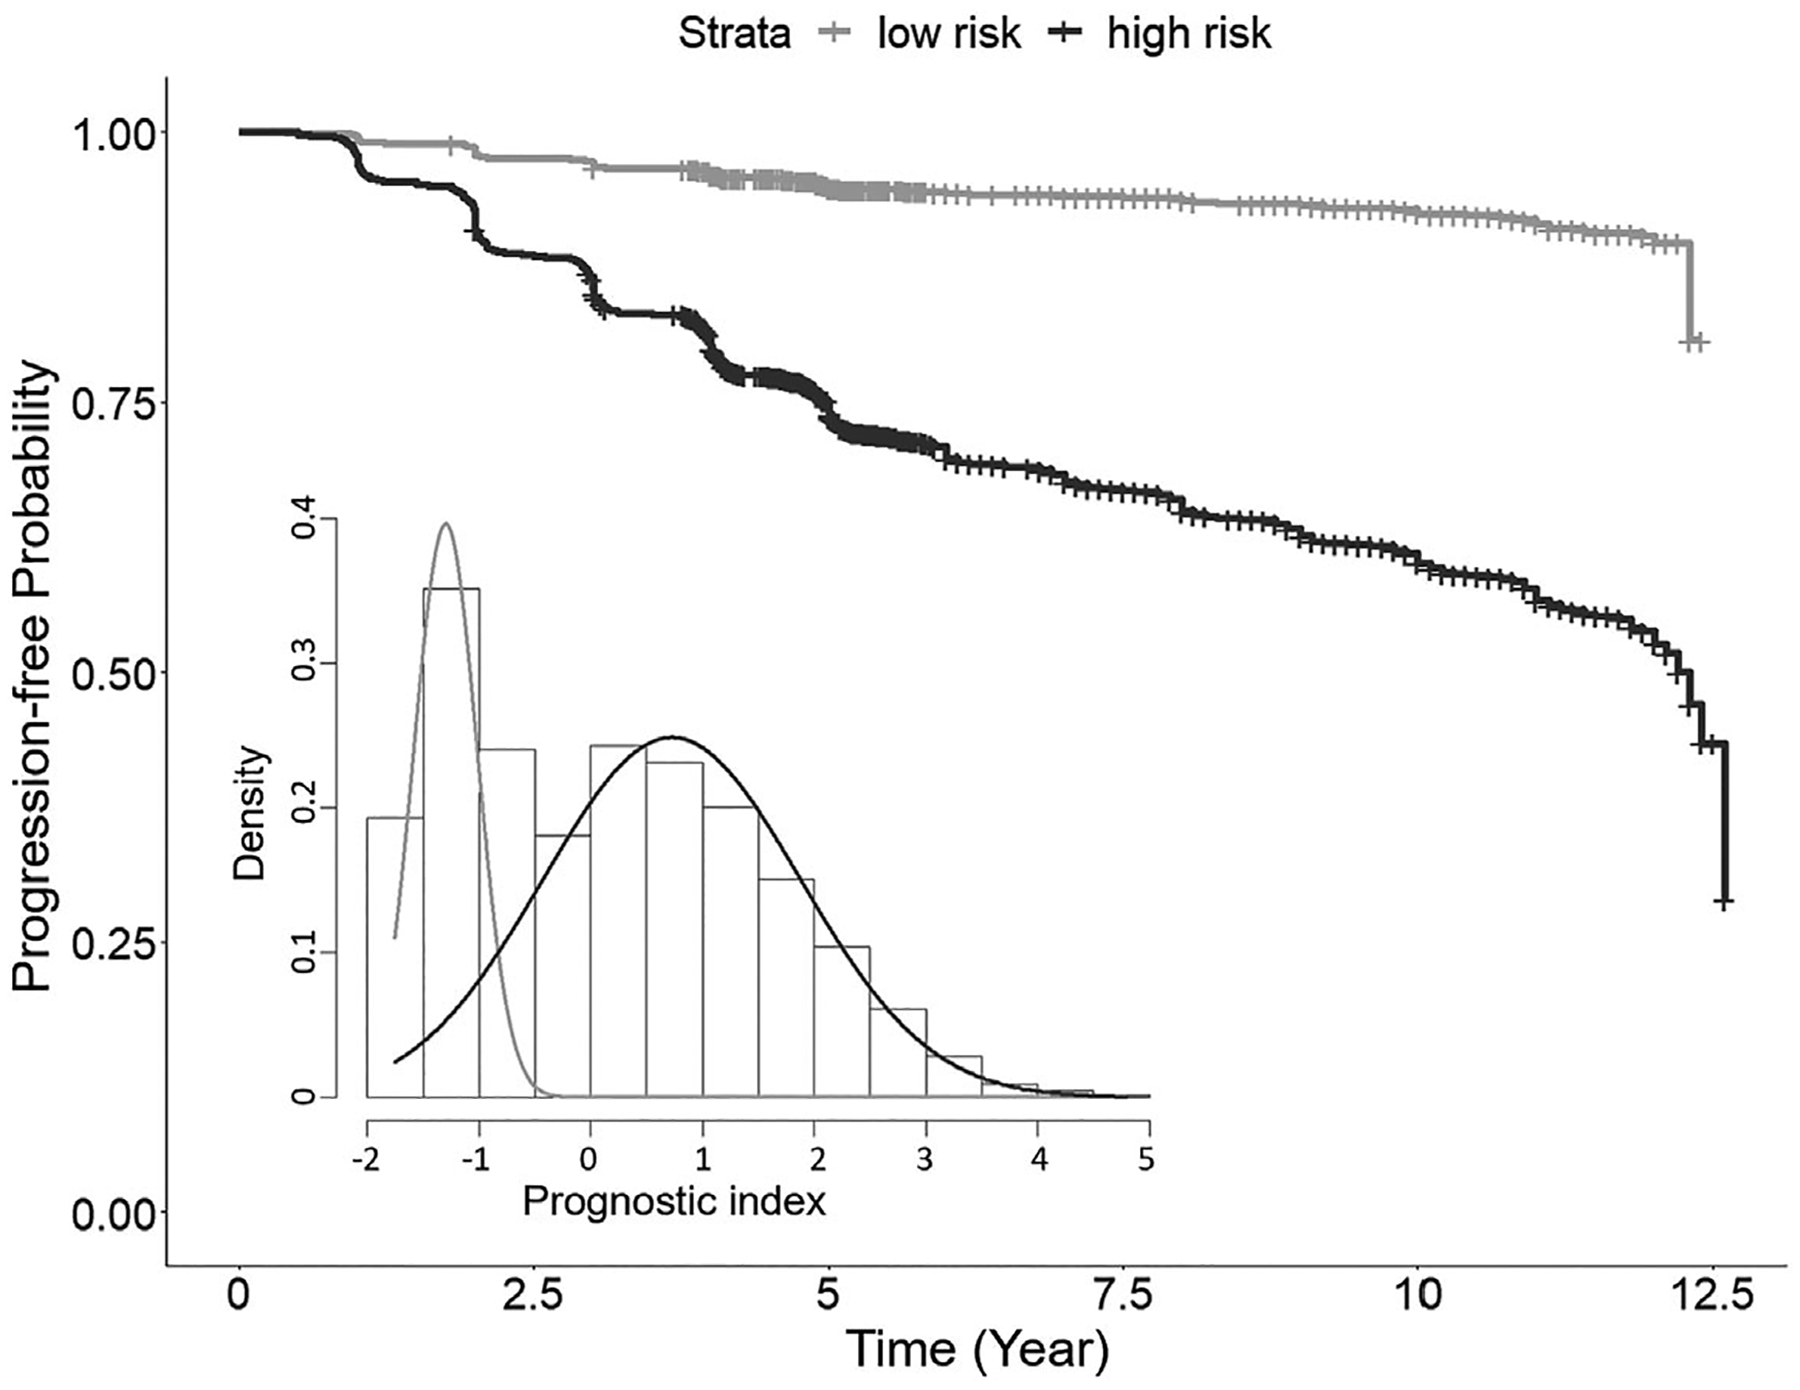
FIGURE 4.

The Kaplan-Meier estimated progression-free profiles for the two identified risk subgroups in the AREDS and AREDS2 test data. The gray curve represents the low-risk subgroup and the black curve represents the high-risk subgroup. The histogram shows the predicted diagnostic index values of all cross-validation results, with two subgroups identified by the Gaussian mixture model. AREDS, age-related eye disease studies
