Figure 3.
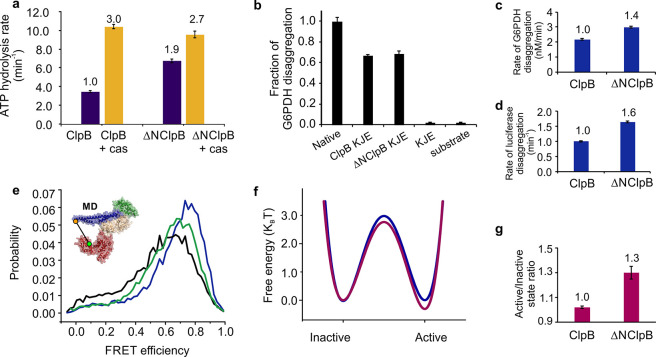
ATPase, disaggregation activities, and MD dynamics of ClpB and ΔNClpB. (a) Rate of ATP hydrolysis measured at 25 °C with and without 50 μM κ-casein (“cas,” n = 3). (b) Disaggregation of heat-induced aggregates of G6PDH as a substrate, measured after 3 h of incubation with ClpB variants (2 μM) in the presence of DnaK, DnaJ, and GrpE (2 μM, 1 μM, and 1 μM, respectively). The fraction of disaggregation was determined by taking the activity of native (nonaggregated) G6PDH as 1 (labeled “Native”, n = 6). (c,d) Rate of disaggregation of heat-induced aggregates of G6PDH (c) or of firefly luciferase (d; see disaggregation yields in the main text) by ClpB variants in the presence of DnaK, DnaJ, and GrpE (n = 3). (e) FRET efficiency histograms of the full-length S428C–S771C construct of ClpB (black) and of the respective ΔNClpB mutant in the presence of 2 mM ATP (green) and in the presence of 25 μM κ-casein (blue). (f) Comparison of the free-energy profiles of MD dynamics of the full-length ClpB (blue) and ΔNClpB (purple), calculated from H2MM parameters using the Arrhenius equation with a pre-exponential factor of 105 s–1. (g) The population ratio of horizontal (inactive) to tilted (active) states of the MD, derived from H2MM analysis. The error bars in all panels correspond to standard errors of the mean. In a, c, d, and e, values above the bars are the fold increases relative to the corresponding values for ClpB (which are set to 1).

