Figure 4.
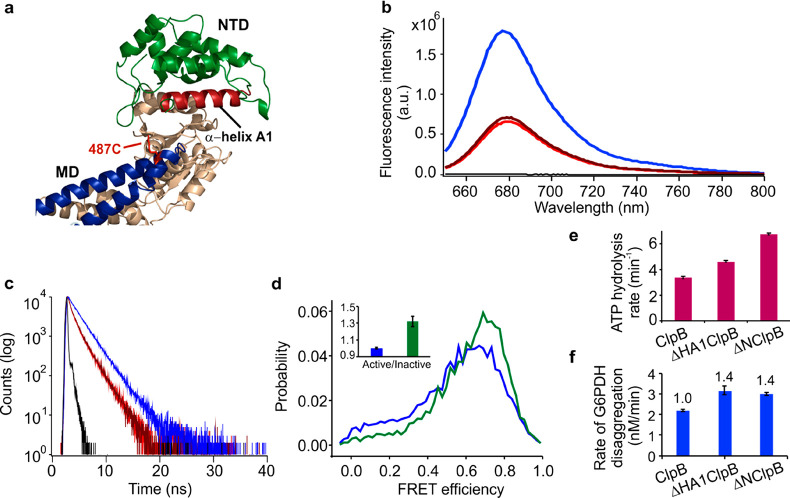
NTD mutants of ClpB affect MD dynamics. (a) Zoom into the upper region of ClpB protomer (crystal structure PDB: 1QVR).12 The MD is colored in blue, and the NTD in green, with α-helix A1 of the NTD highlighted in red. Residue 487C on the MD used for Atto 655 incorporation is shown as red sticks. (b) Steady-state fluorescence spectra of Atto 655-labeled ClpB mutants: ClpB (blue), 12W-ClpB (red), 23W-ClpB (dark red), buffer (black). Average fractions of fluorescence intensity, normalized to the result of the mutant without incorporated tryptophan, were 0.36 for 12W and 0.39 for 23W. (c) Fluorescence decay curves: ClpB (blue), 12W-ClpB (red), 23W-ClpB (dark-red), instrument response function (black). The resulting fluorescence lifetimes were 2 ns for the control ClpB mutant and 1.3 ns for 12W and 23W variants. (d) FRET efficiency histograms of the full-length ClpB (blue) and the truncated ΔHA1ClpB variant (green). Inset shows the corresponding active/inactive state ratios of the MD. (e) ATPase activity of ΔHA1ClpB, compared to the full-length and ΔNClpB variants (n = 4). (f) Rate of disaggregation of G6PDH aggregates in the presence of DnaK, DnaJ, and GrpE (2 μM, 1 μM, and 1 μM, respectively, n = 3). The error bars correspond to standard errors of the mean.

